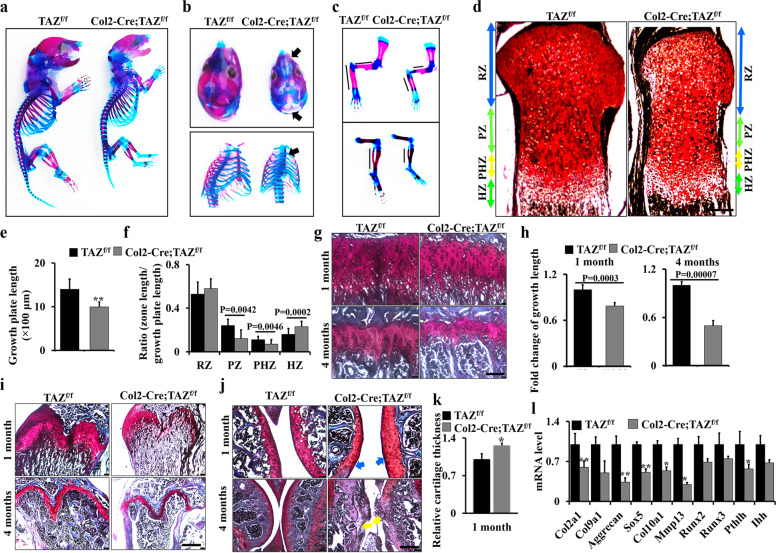
Fig. 2. Deletion of TAZ in chondrocytes inhibits growth plate and articular cartilage development.
a–c Col2-Cre;TAZf/f mice and controls at the newborn stage stained with Alizarin Red and Alcian blue. Calvarium, ribs, sternum, forelimb, and hindlimb are shown in b and c with higher magnification. Black arrows point to the regions of chondrodysplasia (n = 3 mice per group). d Representative Safranin O staining of the growth plate in the proximal tibiae of Col2-Cre;TAZf/f mice and controls at the newborn stage. RZ resting zone, PZ proliferation zone, PHZ prehypertrophic zone, HZ hypertrophic zone. Scale bars, 100 μm. e, f Quantitative analysis of growth plate length (e) and each zone’s lengths of growth plate (f) in Col2-Cre;TAZf/f mice and controls at the newborn (n = 3 mice per group). Data were reported as a ratio of the zone length to the total growth plate length (f). g, h Growth plate sections of the tibiae of Col2-Cre;TAZf/f mice and controls (n = 3 mice per group) from 1- and 4-month-old mice by Safranin O staining (g). Scale bars, 25 μm. The corresponding quantitative analysis was performed (h). i Growth plate sections of the femurs of Col2-Cre;TAZf/f mice and controls (n = 3 mice per group) from 1- and 4-month-old mice by Safranin O staining. Scale bars, 100 μm. j Histological sections of articular cartilage from 1- and 4-month-old male mice by Safranin O staining. Scale bars, 50 μm (upper panel) and 100 μm (lower panel). Blue arrows point to articular cartilage. Yellow arrows point to the regions of impaired articular cartilage integrity. n = 5 mice per group. k The cartilage thickness from Col2-Cre;TAZf/f mice and controls were quantified at 1 month. n = 5 mice per group. l qRT-PCR analysis of chondrocyte differentiation markers using the cartilage samples from Col2-Cre;TAZf/f mice and controls at E15.5. The experiment was independently repeated for three times. Error bars were the means ± SEM of triplicates from a representative experiment. *P < 0.05, **P < 0.01.

