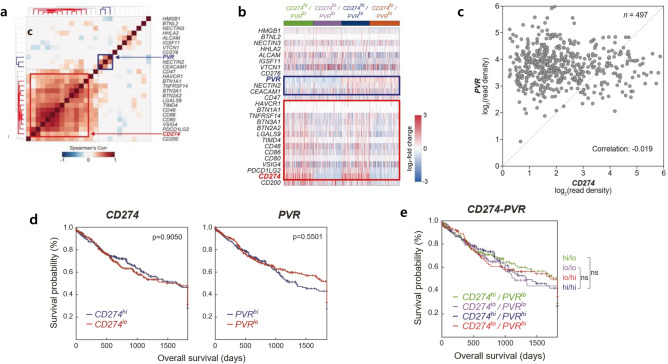
Figure 2.
Co-expression patterns of immune checkpoint ligands (ICLs) and immune checkpoint receptors in The Cancer Genome Atlas data of lung squamous cell carcinoma. (a) Heatmap showing Spearman’s correlation coefficients for all pairs of ICLs. The dendrogram shows the results of hierarchical clustering of ICLs based on the correlation coefficients using Euclidean distance as a dissimilarity measure and the single linkage method. Red boxes represent programmed death ligand-1 (PD-L1/CD274); blue boxes represent poliovirus receptor (PVR). (b) Gene expression patterns of ICLs among four patient groups: (1) PD-L1hi/PVRlo, (2) PD-L1lo/PVRlo, (3) PD-L1hi/PVRhi, and (4) PD-L1lo/PVRhi. Red represents increased median expression and blue represents decreased median expression levels of each ICL. The colored bar shows the gradient of log2 fold-changes in expression levels. (c) Scatter plot showing patterns of PD-L1 and PVR. (d) Kaplan–Meier analysis of overall survival according to high and low PD-L1 (CD274) and PVR expression, respectively. (e) Multivariate analyses of four patient groups show no statistically significant differences between the groups.

