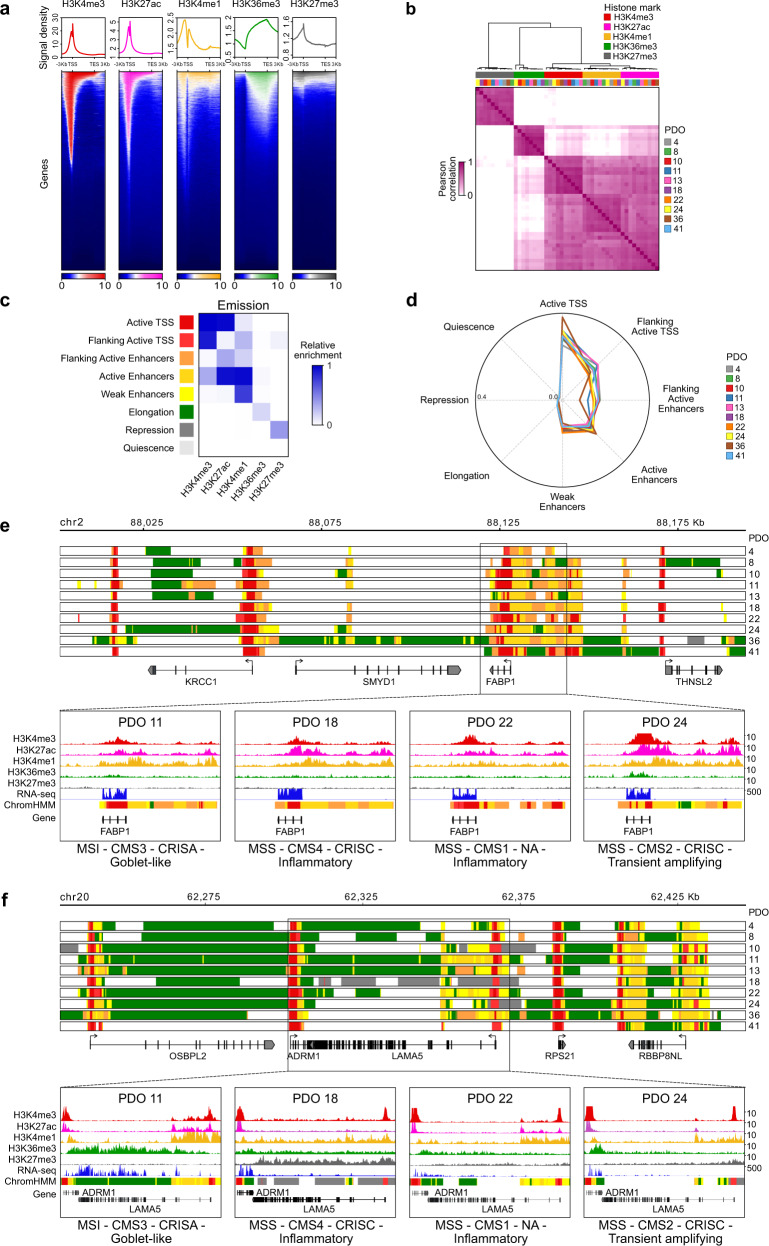
Fig. 2. Characterization of the human CRC epigenome using ChromHMM analysis.
a Histone modifications localization in relation to the gene body as well as regions surrounding ± 3 Kb of the transcription start (TSS) and end (TES) sites. Representative density plots of average intensity (top) and corresponding heatmaps (bottom) display the relative distribution of H3K4me3 (red), H3K27ac (pink), H3K4me1 (yellow), H3K36me3 (green), and H3K27me3 (gray) signals for all the genes present in the GENCODEv25 annotation. b Pearson correlation heatmap of ChIP-seq data for the complete set of five histone modifications across all patient-derived organoids (PDOs). See Supplementary Fig. 2a. c Combinatorial pattern of histone marks in an 8-state model using ChromHMM. The heatmap (Emission plot) displays the frequency of the histone modifications found in each state (Supplementary Fig. 2b). d The probability of each ChromHMM-defined chromatin state overlapping ATAC-seq regions for TCGA colon adenocarcinoma samples is shown across PDOs using a spider plot. e–f Representative tracks of ChromHMM states for the (e) FABP1 and (f) LAMA5 (Supplementary Fig. 3a) genomic loci in all PDOs. The tracks denote regions identified as promoter (red), active enhancer (orange), weak enhancer (yellow), elongation (green), repressed (gray) or quiescent (white) states (Fig. 2c). The expanded regions show H3K4me3, H3K27ac, H3K4me1, H3K36me3, and H3K27me3 profiles, along with RNA-seq signal and ChromHMM states for PDOs of different molecular subtypes as indicated.

