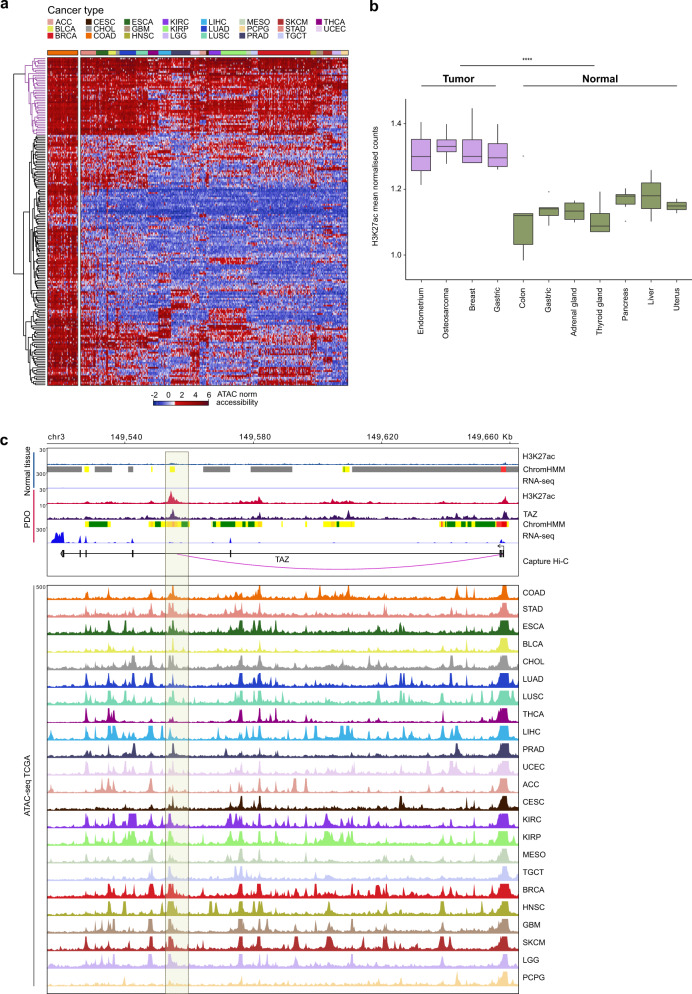
Fig. 5. Conserved human CRC enhancer regions are accessible across diverse cancer types.
a Chromatin accessibility profiles of the 195 conserved gained enhancers in 23 diverse primary human cancer types reveal a signature of 46 pan-CRC enhancers with active chromatin profiles across cancer types (cluster in purple). The heatmap shows hierarchical clustering of log2 normalized insertion counts of ATAC-seq data derived from TCGA (Corces et al.17). Colon adenocarcinoma samples are the first cancer type reported on the left of the heatmap. The color-coded bar above the heatmap represents the different cancer types: ACC adrenocortical carcinoma, BLCA bladder urothelial carcinoma, BRCA breast invasive carcinoma, CESC cervical squamous cell carcinoma, and endocervical adenocarcinoma, CHOL cholangiocarcinoma, COAD colon adenocarcinoma, ESCA esophageal carcinoma, GBM glioblastoma multiforme, HNSC head and neck squamous cell carcinoma, KIRC kidney renal clear cell carcinoma, KIRP kidney renal papillary cell carcinoma, LGG brain lower grade glioma, LIHC liver hepatocellular carcinoma, LUAD lung adenocarcinoma, LUSC lung squamous cell carcinoma, MESO mesothelioma, PCPG pheochromocytoma and paraganglioma, PRAD prostate adenocarcinoma, SKCM skin cutaneous melanoma, STAD stomach adenocarcinoma, TGCT testicular germ cell tumors, THCA thyroid carcinoma, UCEC uterine corpus endometrial carcinoma. b Differences in the H3K27ac intensities of the pan-cancer enhancers in primary tumors (n = 28) relative to normal tissues (n = 15) from public ChIP-seq data. Boxplots describe the median (middle line) and interquartile range (box denoting first and third percentile) with whiskers denoting the minimum and maximum within the 1.5× interquartile range and outlying points beyond the whiskers plotted individually. ****P < 0.0001, two-sided Wilcoxon rank sum exact test. c Genomic overview of the TAZ locus in representative normal tissue and patient-derived organoid (PDO) samples, and in TCGA cancer types. Upper panel: H3K27ac profiles, ChromHMM states and RNA-seq signals in normal tissue; H3K27ac and TAZ profiles, ChromHMM states, and RNA-seq signals in PDO; and CRC capture Hi-C data. Bottom panel: ATAC-seq profiles for 23 TCGA cancer types. The shaded box indicates a CRC-conserved and YAP/TAZ-bound ChromHMM-defined active enhancer for which a promoter-enhancer interaction is reported using CRC capture Hi-C data. See Fig. 2c, e for details on ChromHMM tracks.

