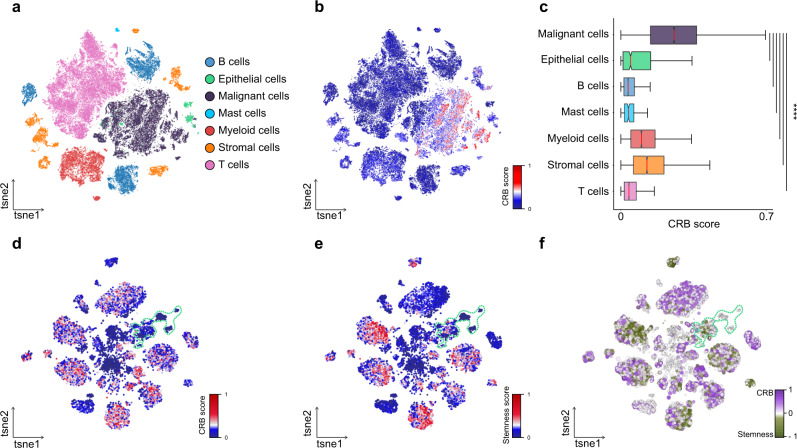
Fig. 6. Distribution of cancer epigenetic deregulation at single-cell level.
a t-distributed stochastic neighbor embedding (t-SNE) visualization depicting the major cell types identified in scRNA-seq data of primary tumor and normal tissues from 23 CRC patients. b t-SNE visualization of the CRB scores across all cell populations. c Malignant cells display significantly higher CRB scores. Distribution of the CRB score in the malignant (gray; n = 17,469) and non-malignant epithelial clusters (green; n = 1070), and in all other major cell populations (B cells n = 9146; Mast cells n = 187; Myeloid cells n = 6769; Stromal cells n = 5933; T cells n = 23,115). Boxplots describe the median (middle line) and interquartile range (box denoting first and third percentile) with whiskers denoting the minimum and maximum within the 1.5× interquartile range. ****P < 0.0001, two-sided Mann–Whitney U test. d–e t-SNE representation of the CRB (d) and stemness (e) scores across 18,539 epithelial cells. Contour lines denote normal epithelial cells. f The cancer regulatory blueprint does not relate to stemness. t-SNE representation of the difference between the CRB and stemness score across all epithelial cells. Cells depicted in gray display similar levels of the two scores, whereas cells in purple and green display mutually exclusive high levels of CRB or stemness, respectively. Contour lines denote normal epithelial cells.

