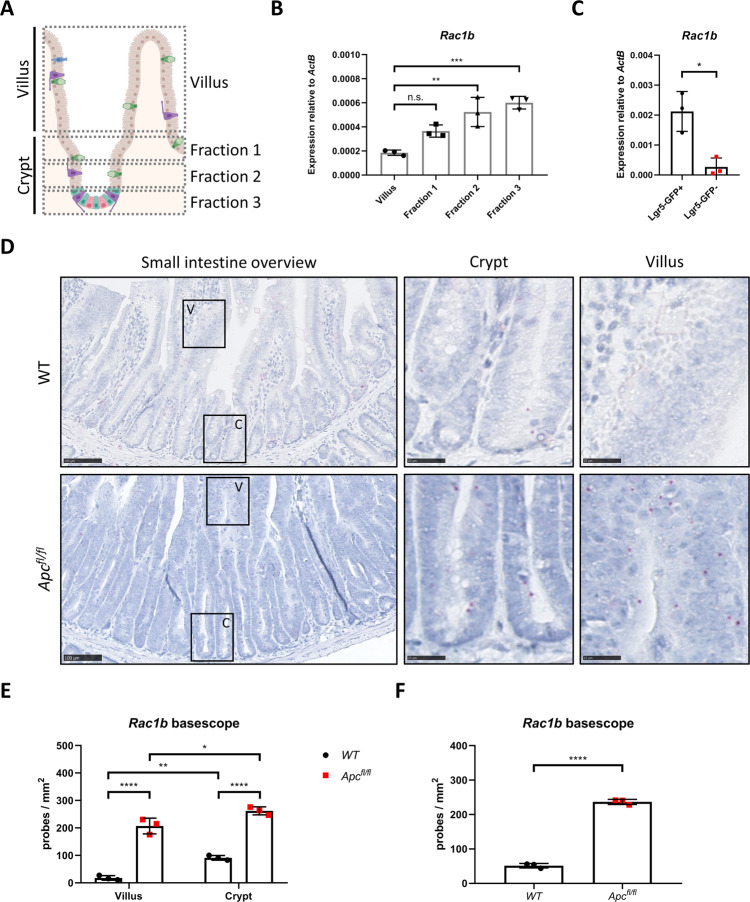
Fig. 2. Rac1b is expressed in intestinal crypt cells and its expression increases following Apc deletion.
A Schematic outlining crypt extraction protocol. B qRT-PCR of Rac1b from villus and crypt fractions (data are presented as mean ± SD; **P = 0.0018, ***P = 0.0005; one-way ANOVA with Tukey multiple correction, n = 3 biologically independent mice). C qRT-PCR of Rac1b from sorted Lgr5+ and Lgr5- cells (data are presented as mean ± SD; *P = 0.0117; two-tailed t-test, n = 3 biologically independent mice). D Representative images of Rac1b basescope of WT and Apcfl/fl small intestinal tissue. Magnified areas are shown in right panels. Pink dots are positive probe detection. Scale bars are 100 µm (left panels) and 25 µm (magnified). E Quantification of Rac1b basescope probe counts comparing WT vs Apcfl/fl small intestine separated by villus and crypt regions (data are presented as mean ± SD; *P = 0.018, **P = 0.0034, ****P = 4 × 10⁻⁶ (WT vs Apcfl/fl villus), ****P = 8.62 × 10⁻⁶ WT vs Apcfl/fl crypt); two-way ANOVA with Tukey multiple correction, n = 3v3 biologically independent mice. For each mouse, at least five areas for crypt and villus regions were scored. In total, these areas incorporated at least 50 crypt/villus axes and covered ~2 mm2 total area). F Quantification of Rac1b basescope probe counts comparing WT vs Apcfl/fl across the entire small intestine (data are presented as mean ± SD; ****P = 5.47 × 10⁻⁶; two-tailed t-test, n = 3v3 biologically independent mice). Source data are provided as a Source Data file.

