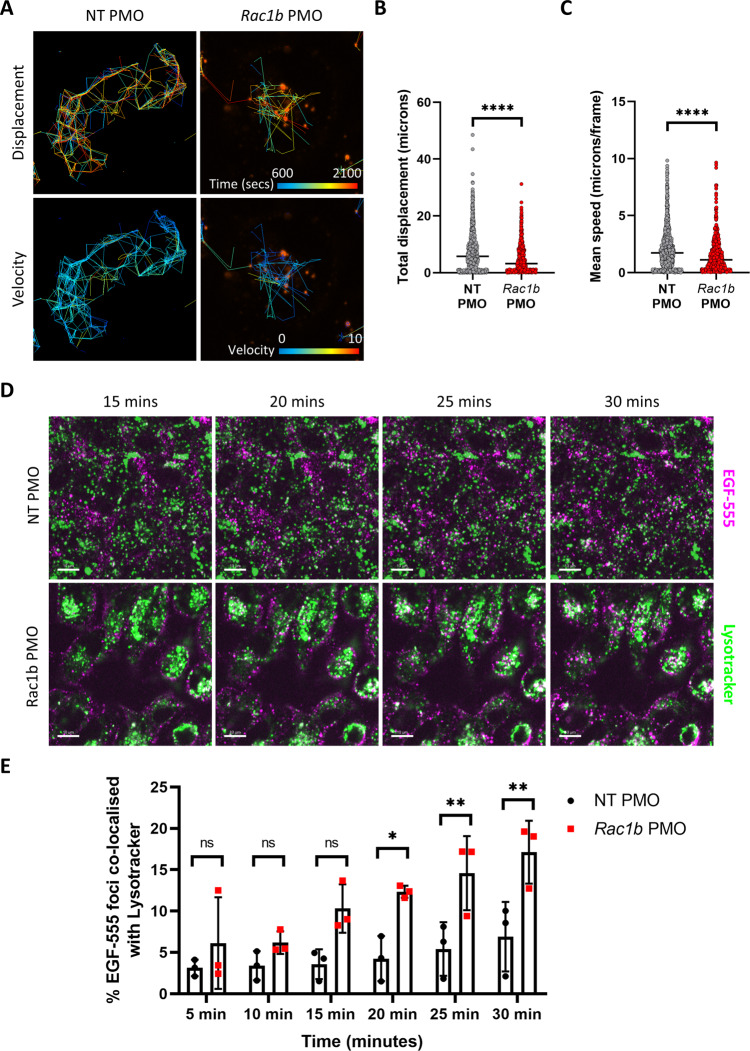
Fig. 6. RAC1B mediates EGFR signalling and its depletion sensitises mouse tumour organoids to EGFR inhibition.
A Live cell imaging of Alexa 555‐EGF tracking with time and velocity represented as colour spectrums. Tracking started after addition of EGF-555 and was carried out for the indicated time period. B Individual value plot of quantification of tracking distance of EGF-555-positive vesicles (median value indicated; ****P = 1.67 × 10⁻¹³; two-tailed t-test; n = 1213 vs 658 foci). C Individual value plot of quantification of tracking velocity of EGF-555-positive vesicles (median value indicated; **** P = 6.93 × 10⁻¹¹; two-tailed t-test; n = 1213 vs 658 foci). D Representative images of live cell imaging of Alexa EGF-555 (magenta) and LysoTracker Green (green) at indicated time points post EGF-555 addition. White arrows indicate areas of EGF-555 LysoTracker co-localisation. Co-localised foci are observed as white dots. Scale bars are 10 μm. E Quantification of the percentage of EGF-555 foci co-localised with LysoTracker Green at indicated time points (data are presented as mean ± SD; *P = 0.0263, **P = 0.0094 (25 min), **P = 0.0094 (30 min), two-way ANOVA with Tukey multiple correction; n = 3v3 independent treatment experiments). Source data are provided as a Source Data file.

