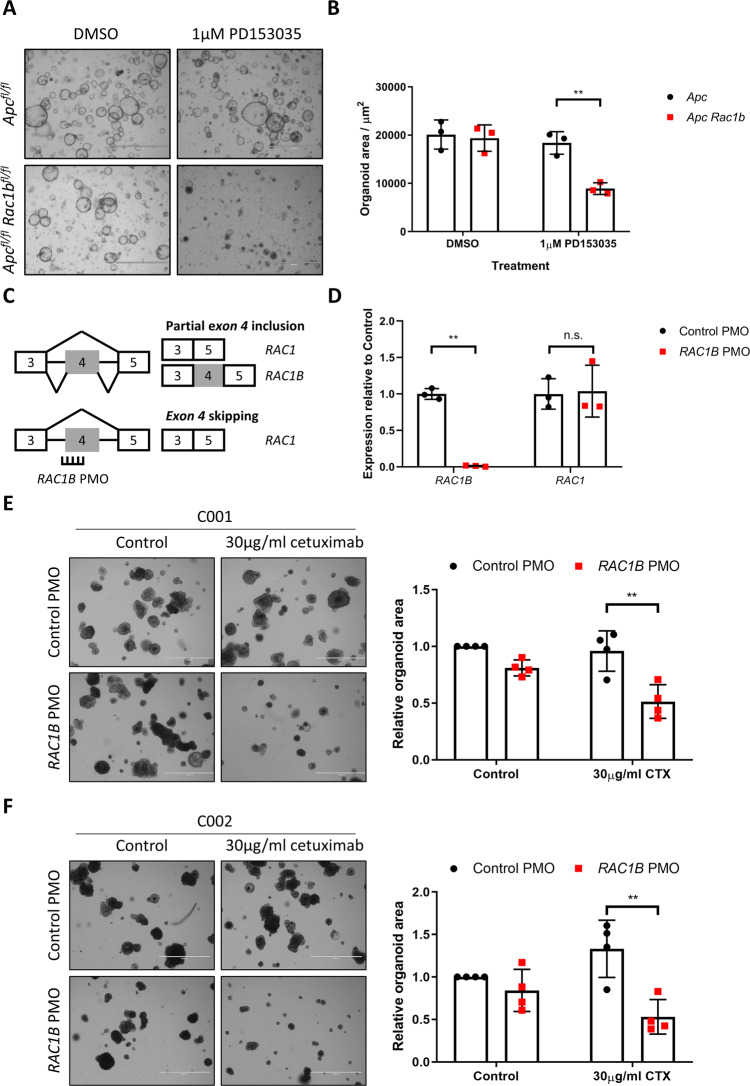
Fig. 7. Depletion of RAC1B in human tumour organoids sensitises to EGFR inhibition.
A Representative images of Apcfl/fl and Apcfl/fl Rac1bfl/fl organoids grown with or without the EGFR inhibitor PD153035. Scale bars are 1000 µm. B Quantification of organoid size 20 h after addition of PD153035 (data are presented as mean ± SD; **P = 0.0061; two-way ANOVA with Tukey multiple correction; n = organoids from 3v3 mice). C Schematic outlining design of RAC1B PMO. D qRT-PCR analysis of PDOs treated with control or RAC1B PMO (data are presented as mean ± SD; **P = 0.0019; two-way ANOVA with Tukey multiple correction; n = 3v3 independent treatment experiments). E Representative images (left panel) and quantification (right panel) of C001 organoid PDOs treated with control or RAC1B PMO in the presence or absence of cetuximab (left panel) (data are presented as mean ± SD; **P = 0.0011; two-way ANOVA with Tukey multiple correction; n = 4v4 independent treatment experiments). Scale bars are 1000 µm. F Representative images (left panel) and quantification (right panel) of C002 organoid PDOs treated with control or RAC1B PMO in the presence or absence of cetuximab (left panel) (data are presented as mean ± SD; **P = 0.0019; two-way ANOVA with Tukey multiple correction; n = 4v4 independent treatment experiments). Scale bars are 1000 µm. Source data are provided as a Source Data file.

