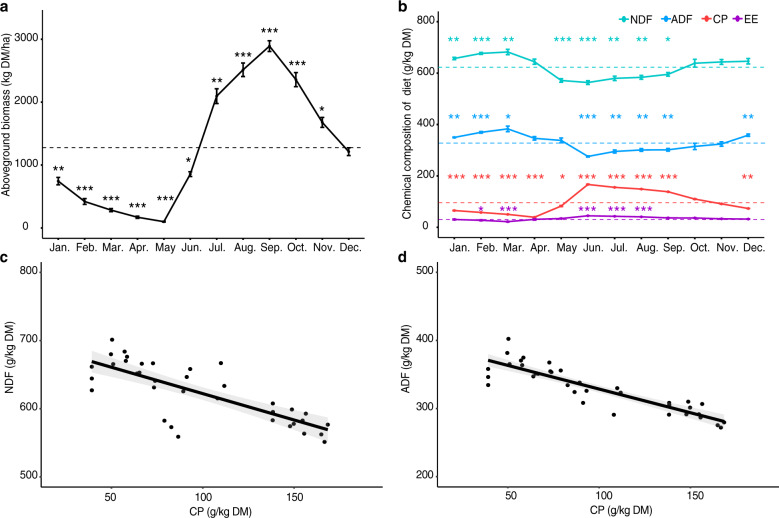
Fig. 3. Seasonal dynamics in above-ground biomass (AGB) and chemical composition (dry matter basis) of the diets year-round in the open-continuous grazing grassland.
a Line chart represents the AGB (kg DM/ha). The dashed line is the mean AGB year-round. b Line chart represents chemical composition (crude protein (CP), ether extract (EE), acid detergent fiber (NDF), and neutral detergent fiber (ADF)) of diet year-round. The dashed lines are the mean of each chemical composition year-round and are colored by each chemical composition. Values and error bars are shown as means ± SE. Average contents of CP are correlated negatively with those of NDF (R2 = 0.59, p < 0.001) (c) and ADF (R2 = 0.78, p < 0.001) (d). Statistic tests are performed by the t-test with FDR (false discovery rate) corrected p-value, *p < 0.05, **p < 0.01, ***p < 0.001.

