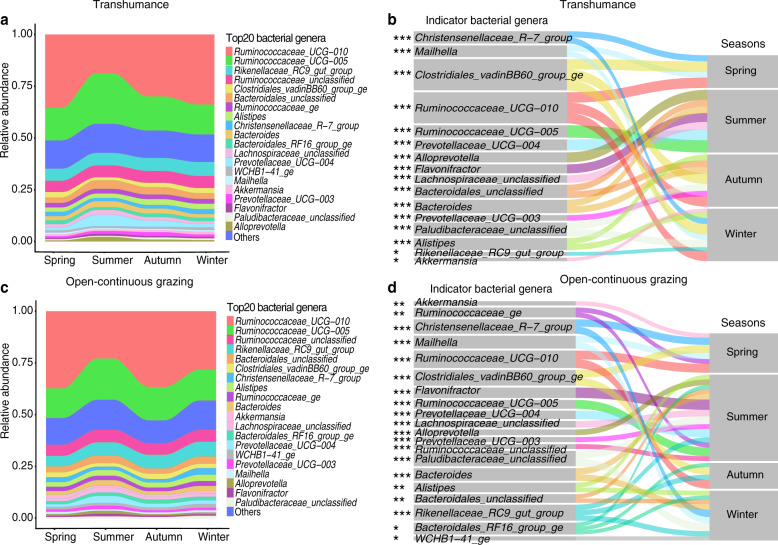
Fig. 4. Seasonal variations of yak gut microbiota at the genus level in transhumance and open-continuous grazing regimes.
Relative abundance of the 20 most abundant genera over seasons (spring, summer, autumn, and winter) are aggregated and colored on a stream-graph in (a) transhumance and (c) open-continuous grazing regimes. Low abundance taxa (except for 20 most abundant genera) are grouped together as “others”. Indicator genera that are related to each season are tracked using Sankey plots in transhumance (b) and open-continuous grazing (d) regimes. Lines represent associations between indicator genera and seasons, which are colored by genus level. Line width is scaled to reflect indicator value (higher indicator value of genus is more strongly associated with the season). Indicator value are shown in Supplementary Fig. 7. The statistical p values mean the genus associated with seasons. *p < 0.05, **p < 0.01, ***p < 0.001.

