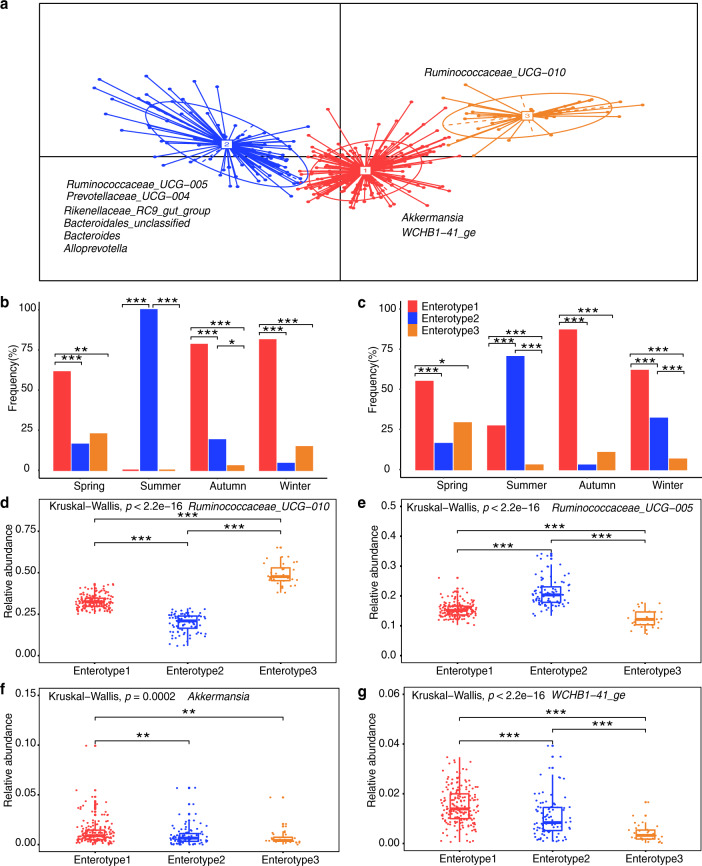
Fig. 7. Enterotype distributions of yak gut microbiota associated with season using Bray–Curtis dissimilarity.
Identification of yak enterotypes is presented in Supplementary Fig. 9. a Visualizations of enterotypes, as identified by PAM (partitioning around medoid) clustering. Genera corresponding to each enterotype are identified by their relative abundance (see Supplementary Fig. 10). b and c Proportion of samples for each enterotype in spring, summer, autumn, and winter in (b) transhumance and (c) open-continuous grazing regimes. d–g Relative abundance of bacterial taxa characteristic of each enterotype. Ten genera were chosen based on their average contribution to overall Bray–Curtis dissimilarity. All six bacterial genera are presented in Supplementary Fig. 10. Colors correspond to enterotype clusters. All bar distributions are tested by Fisher’s exact test with FDR (false discovery rate) corrected two-tailed p-values (b and c). All boxplot distributions are tested by non-parametric Kruskal–Wallis and Wilcoxon with FDR-corrected p-value, center values indicated the median and error bars (d–g). *p < 0.05, **p < 0.01, ***p < 0.001.

