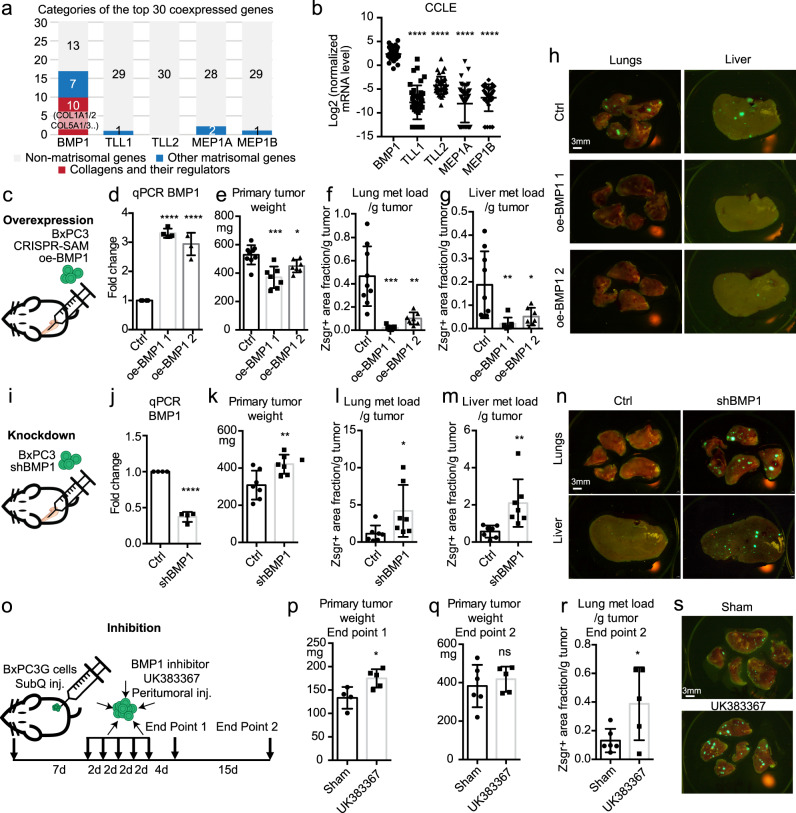
Fig. 2. BMP1 suppresses tumor growth and metastasis in PDAC.
a The top 30 positively coexpressed genes ranked by correlation coefficients with BMP1, but not TLL1/2, or MEP1A/1B, have a high fraction of matrisomal (blue or red) genes, especially collagen-related genes (red), using the TCGA dataset in cBioPortal. b BMP1 has the highest mRNA expression level in a panel of 41 cultured PDAC cell lines using the CCLE dataset. c–h Orthotopic injection of BxPC3 cells (c) overexpressing BMP1 with two different guides using a CRISPR-activation method (d) resulted in reduced primary tumor weight (e), and reduced lung (f) and liver (g) metastasis load after normalization to primary tumor weight. Representative lung and liver metastasis images are shown in h. Mouse numbers are 9, 7, 7 (e–g, left to right). i–n Orthotopic injection of BxPC3 cells (i) knocked down for BMP1 expression (j) resulted in increased primary tumor weight (k), and increased lung (l) and liver (m) metastasis load after normalization to primary tumor weight. Representative lung and liver metastasis images are shown in n. The numbers of mice are 7 for both groups. o–s subcutaneous injection of lung-metastasis-selected BxPC3 cells followed by peritumoral injection of BMP1 inhibitor UK383367 (o) resulted in increased primary tumor growth (end point 1, p) and increased normalized metastasis load despite no significant change in primary tumor weight (end point 2 q, r). Lung metastasis images are shown in s. Mouse numbers are 4 and 5 (end point 1) and 6 and 5 (end point 2, left to right). *p < 0.05; **p < 0.01; ***p < 0.001; ****p < 0.0001. ns not significant. This labeling scheme applies to all related figures. All p-values come from two-tailed Student’s t-tests. All columns are represented by mean ± SD.

