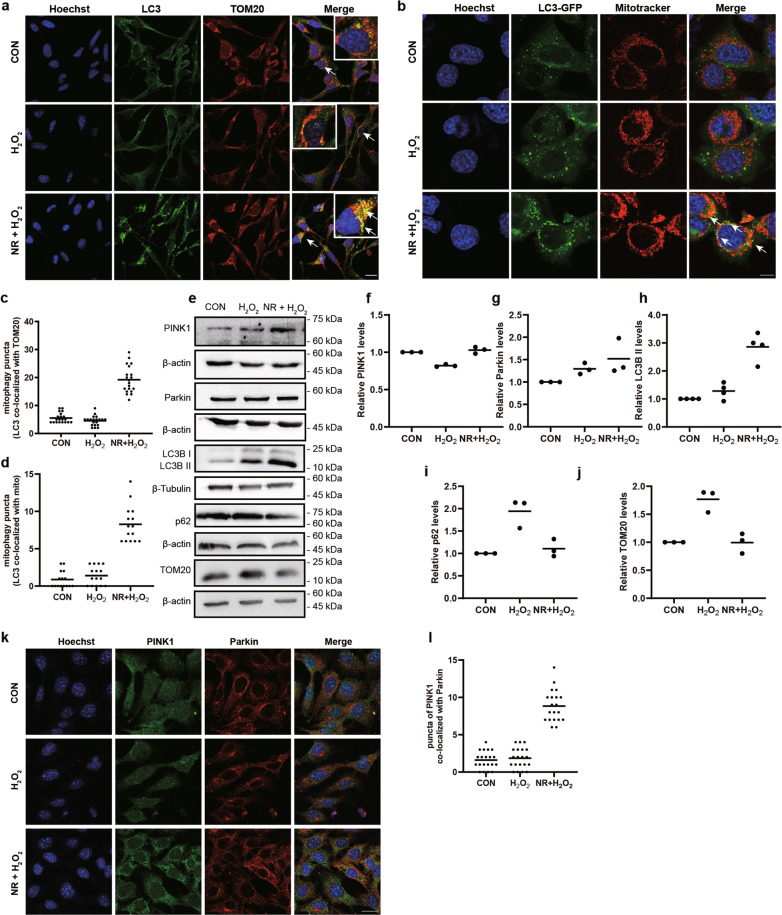
Fig. 2. NR-induced mitophagy in H2O2-treated 661w cells.
a, c Representative images of fluorescence-labeled mitophagy marker and mitochondrial marker. LC3 (green) and TOM20 (red) were immunolabeled, and nuclei were stained with Hoechst 33342 (blue). Scale bars: 25 μm. The number of yellow puncta (co-localization of LC3 and TOM20) were calculated in 20 cells and analyzed, showing activation of mitophagy in H2O2-treated 661w cells after NR pretreatment. b, d Representative images of 661w cells transduced with LC3-GFP virus and stained with Mito-Tracker Red CMXRos. LC3-GFP: green, mitochondrion: red and nuclei: blue. Scale bar: 10 μm. The number of mitophagy puncta were calculated in 15 cells and analyzed, showing NR increased the co-localization of LC3-GFP and mitochondria. e–j Western blot analysis of mitophagy-related proteins, PINK1, Parkin, LC3, p62, and TOM20. The relative expression of each protein was normalized to loading control (n ≥ 3). k, l Representative images of fluorescence-labeled PINK1 and Parkin. PINK1 (green) and Parkin (red) were immunolabeled, and nuclei were stained with Hoechst 33342 (blue). Scale bars: 25 μm. The co-localized puncta of PINK1 and Parkin were calculated in 20 cells and analyzed, showing the translocation of Parkin after NR treatment. Data are shown as mean.

