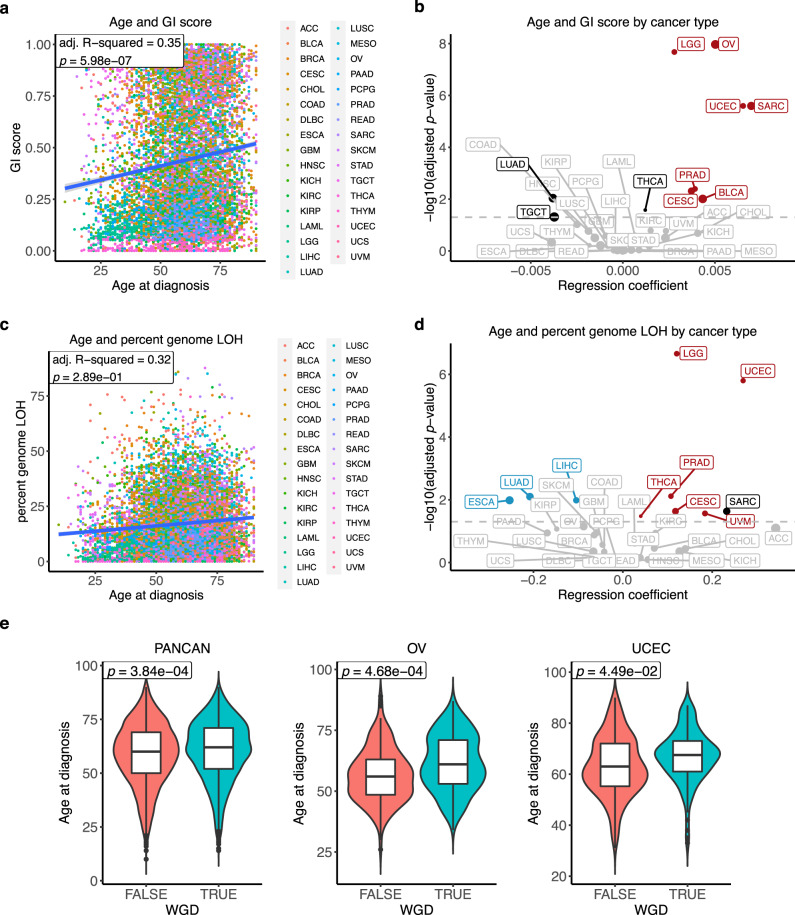
Fig. 1. Association between cancer patients’ age and genomic instability (GI) score, percent genomic loss-of-heterozygosity (LOH) and whole-genome duplication events (WGD).
a Association between age and pan-cancer GI score. Dots are coloured by cancer type. Multiple linear regression R-squared and p value are shown in the figure. Multiple-hypothesis testing correction was not performed (single test). b Association between age and cancer type-specific GI score. Linear regression coefficients and significant values are shown in the figure. Multiple-hypothesis testing correction was done using Benjamini–Hochberg procedure. Cancers with a significant positive association between age and GI score after using multiple linear regression (adj. p value < 0.05) are highlighted in red. Cancers with a significant association in simple linear regression but not significant after using multiple linear regression are showed in black. The grey line indicates adj. p value = 0.05. Dot size is proportional to median GI score. c Association between age and pan-cancer percent genomic LOH. Dots are coloured by cancer type. Multiple linear regression R-squared and p value are shown in the figure. Multiple-hypothesis testing correction was not performed (single test). d Association between age and cancer type-specific percent genomic LOH. Linear regression coefficients and significant values are shown in the figure. Multiple-hypothesis testing correction was done using Benjamini–Hochberg procedure. Cancers with a significant positive and negative association between age and percent genomic LOH after using multiple linear regression are highlighted in red and blue, respectively. Cancer with a significant association in simple linear regression but not significant after using multiple linear regression is showed in black. The grey line indicates adj. p value = 0.05. Dot size is proportional to median percent genomic LOH. e Association between age and WGD events in pan-cancer (FALSE n = 5313, TRUE n = 4365 samples), OV (FALSE n = 207, TRUE n = 349 samples), and UCEC (FALSE n = 294, TRUE n = 140 samples). Multiple logistic regression p values were indicated in the figure. Multiple-hypothesis testing correction was done using Benjamini–Hochberg procedure. The middle bar of the boxplot is the median. The box represents interquartile range (IQR), 25th to 75th percentile. Whiskers represent a distance of 1.5 × IQR. TCGA cancer type acronyms and their associated name are provided in Table 1.

