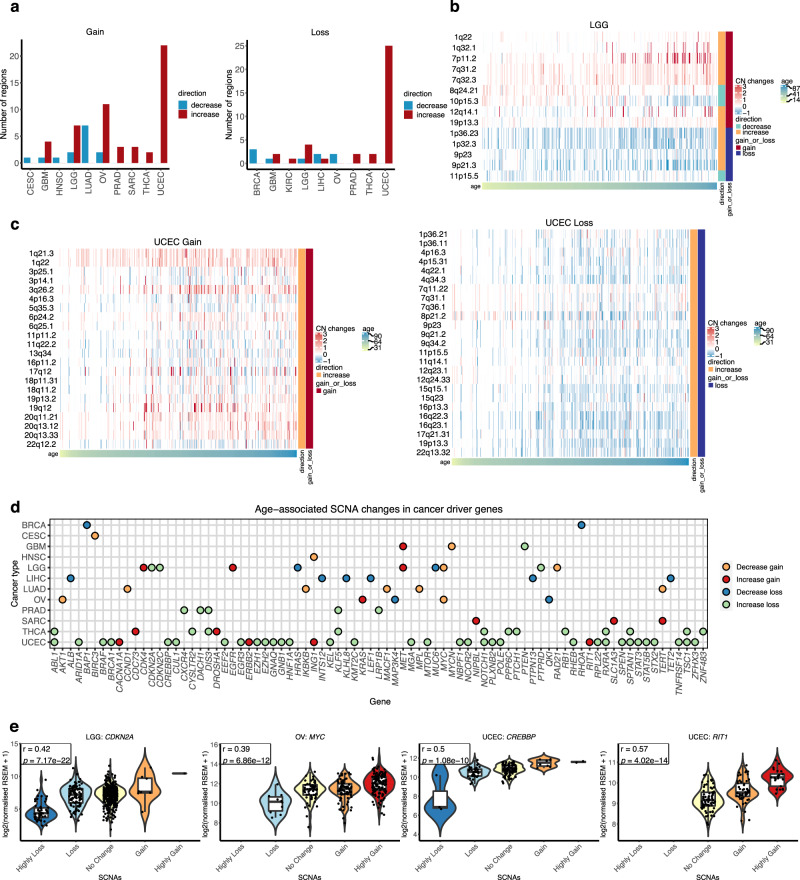
Fig. 3. Association between cancer patients’ age and focal-level SCNAs.
a Number of gained and deleted focal regions that showed a significant association with age per cancer type (multiple logistic regression, adj. p value < 0.05). Multiple-hypothesis testing correction was done using Benjamini–Hochberg procedure. Heatmap showing age-associated focal-level SCNAs in (b) LGG and (c) UCEC. Samples are sorted by age. Colours represent copy-number changes from GISTIC2.0, blue denotes loss and red corresponds to gain. The gain_or_loss legend demonstrates that the region is recurrently gained or deleted. The direction legend shows whether the gain/loss of the region increases or decreases with age. d Age-associated SCNA changes in cancer-driver genes. Cancer-driver genes located in the age-associated focal regions are plotted by cancer type. Colours of the dot represent the condition of the focal region where the gene located in as follows: blue—decrease loss; green—increase loss; yellow—decrease gain; and red—increase gain with age. e The effect of copy-number changes on gene expression of CDKN2A in LGG (Highly Loss n = 50, Loss n = 102, No Change n = 327, Gain n = 8, Highly Gain n = 1 samples), MYC in OV (Highly Loss n = X, Loss n = 10, No Change n = 56, Gain n = 82, Highly Gain n = 140 samples), CREBBP (Highly Loss n = 3, Loss n = 36, No Change n = 101, Gain n = 8, Highly Gain n = 2 samples) and RIT1 (No Change n = 72, Gain n = 53, Highly Gain n = 25 samples) in UCEC. These are examples of genes with age-associated changes in SCNAs. Violin plots show the log2 (normalised expression + 1) of samples grouped by their SCNA status. Pearson correlation coefficient r and p value (two-sided test) are shown in the figures. The middle bar of the boxplot is the median. The box represents interquartile range (IQR), 25–75th percentile. Whiskers represent a distance of 1.5 × IQR. TCGA cancer type acronyms and their associated name are provided in Table 1.

