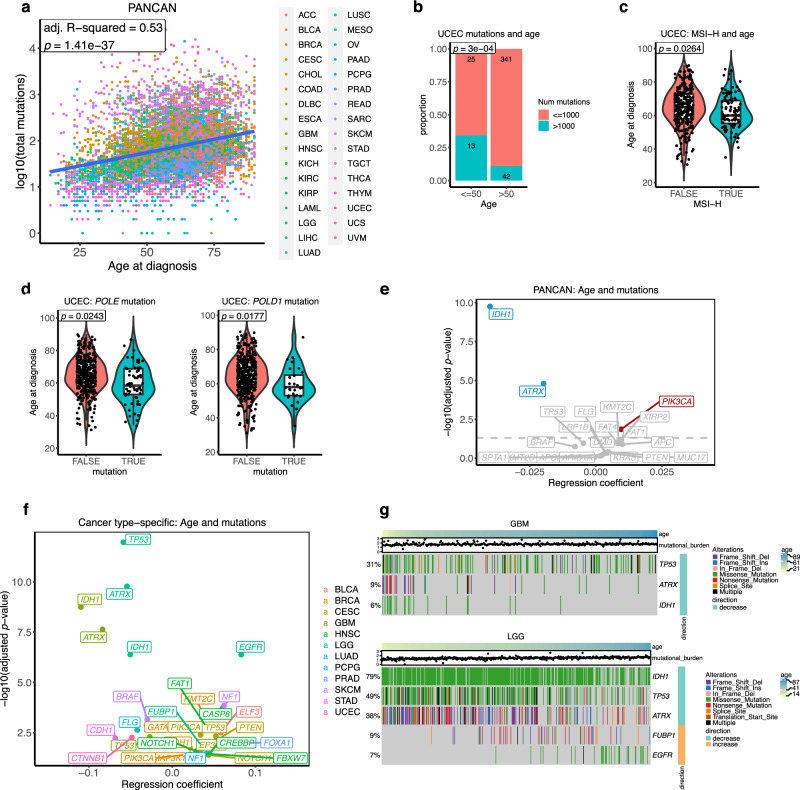
Fig. 4. Association between cancer patients’ age and somatic mutations.
a Association between patient’s age and mutation burden in pan-cancer. Adjusted R-squared and p value from multiple linear regression analysis are presented. Multiple-hypothesis testing correction was not performed (single test). b The proportion of hypermutated tumours (>1000 mutations/exome) in young (age ≤ 50) and old (age > 50) UCEC. The statistical significant (p value) was calculated using two-sided Fisher’s exact test. c The association between age and MSI-H in UCEC. FALSE n = 286, TRUE n = 106 samples. The statistical significance (p value) was calculated from the multiple logistic regression adjusting for clinical variables. d The association between age and POLE/POLD1 mutations in UCEC. POLE FALSE n = 359, TRUE n = 62 samples. POLD1 FALSE n = 392, TRUE n = 29 samples. The statistical significance (p value) was calculated from the multiple logistic regression adjusting for clinical variables. The middle bar of the boxplot is the median. The box represents interquartile range (IQR), 25–75th percentile. Whiskers represent a distance of 1.5 × IQR. e A pan-cancer association between age and mutations. Multiple logistic regression coefficient and significant values are shown. Multiple-hypothesis testing correction was done using Benjamini–Hochberg procedure. Genes with a significant positive and negative association between age and somatic mutations after using multiple logistic regression (adj. p value < 0.05) are highlighted in red and blue, respectively. f Summary of the cancer type-specific association between age and mutations. Multiple logistic regression coefficient and significant values are shown. Multiple-hypothesis testing correction was done using Benjamini–Hochberg procedure. Only genes with a significant association (adj. p value < 0.05) are shown in the figure. A colour code is provided to denote the cancer type where the association between age and gene mutation was found. g Heatmap showing age-associated mutations in GBM and LGG. Samples are sorted by age. Colours represent types of mutation. The right annotation legend indicates the direction of change, increase or decrease mutations with age. The mutation burden of samples is presented in the dot above the heatmap. TCGA cancer type acronyms and their associated name are provided in Table 1.

