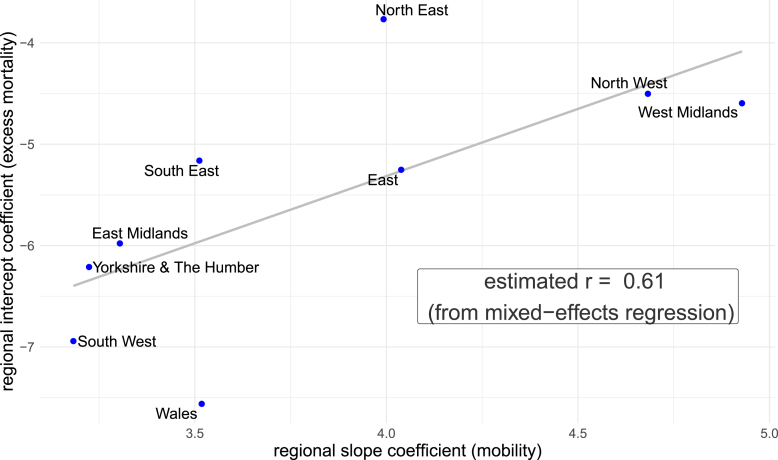
Fig. B.3.
Estimated region-specific intercepts and mobility coefficients, as well as their estimated correlation r from the mixed-effects regression in nine regions of England and Wales (excluding London) during weeks 13–33 of 2020. Source: Authors' own elaboration based on data from Office for National Statistics (2021, 2020a) and Google LLC (2021).

