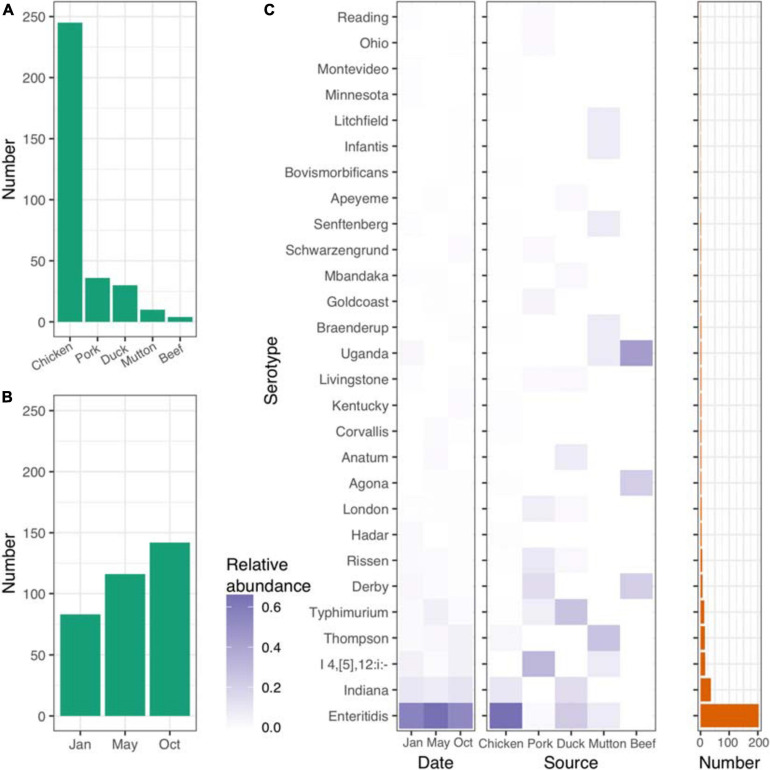
FIGURE 1.
Distribution of isolates and Salmonella serovars. (A) Number of isolates from five different retail meats. (B) Number of isolates from different sampling time points. (C) Distribution of serovars across different time points and retail meats. Left panel, time points; middle panel, retail meats; right panel, number of each serovar.

