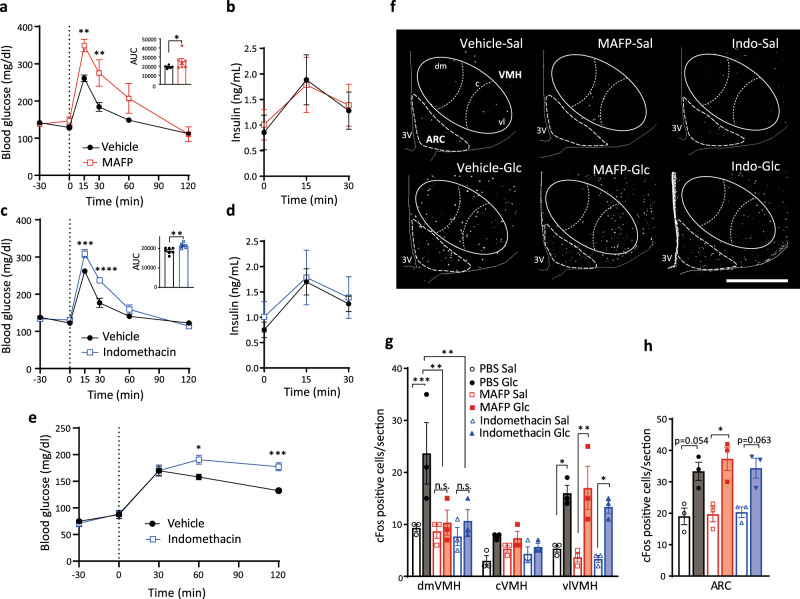
Fig. 2. Hypothalamic PLA2- and COX-mediated AA metabolism regulates systemic glucose tolerance and modulates glucose responsiveness in the dmVMH.
a Glucose tolerance test (GTT; 0–120 min) after intra-hypothalamic injection (−30 min) of MAFP (n = 7) or vehicle (n = 7; two-way ANOVA followed by Sidak multiple comparison test, p = 0.0065 at time = 15, p = 0.0045 at time = 30, MAFP vs Vehicle; two-tailed t test in area under the curve (AUC) during GTT, p = 0.0422, MAFP vs Vehicle). b Blood insulin concentration of MAFP (n = 6) or vehicle (n = 6) injected mice during GTT. c GTT (0–120 min) after intra-hypothalamic injection (−30 min) of indomethacin (n = 6) or vehicle (n = 7; two-way ANOVA followed by Sidak multiple comparison test, p = 0.0002 at time = 15, p < 0.0001 at time = 30, indomethacin vs Vehicle; two-tailed t test in AUC during GTT, p = 0.0074, indomethacin vs Vehicle). d Blood insulin concentration of indomethacin (n = 6) or saline (n = 7) injected mice during GTT. e Blood glucose levels in refeeding after intra-hypothalamic injection (−30 min) of indomethacin (n = 6) or vehicle (n = 5; two-way ANOVA followed by Sidak multiple comparison test, p = 0.0141 at time = 60, p = 0.0004 at time = 120, indomethacin vs Vehicle). f Representative micrographs showing immunofluorescent cFos staining in the hypothalamus of saline (upper panels) or glucose (lower panels) injected mice after i.c.v. injection of PBS, MAFP, or indomethacin (indo). Scale bar: 500 μm. dm dorsomedial, c central, vl ventrolateral part of the VMH. g, h Quantification of cFos expression in the dorsomedial (dmVMH), central (cVMH), and ventrolateral (vlVMH) subregions of the VMH (g) and ARC (h) from mice injected with saline or glucose after i.c.v. injection of PBS, MAFP, or indomethacin (n = 3 in each experimental group; VMH: two-way ANOVA followed by Sidak multiple comparison test, for dmVMH: p = 0.0004 PBS Glc vs PBS Sal, p = 0.0011 PBS Glc vs MAFP Glc, p = 0.0015 PBS Glc vs Indomethacin Glc, for vlVMH, p = 0.0145 PBS Sal vs PBS Glc, p = 0.0011 MAFP Sal vs MAFP Glc, p = 0.0269 Indomethacin Sal vs Indomethacin Glc. For ARC: one-way ANOVA followed by Sidak multiple comparison test, p = 0.0124 MAFP Sal vs MAFP Glc. All data represent the mean ± SEM; *p < 0.05; **p < 0.01; ***p < 0.001; ****p < 0.0001.

