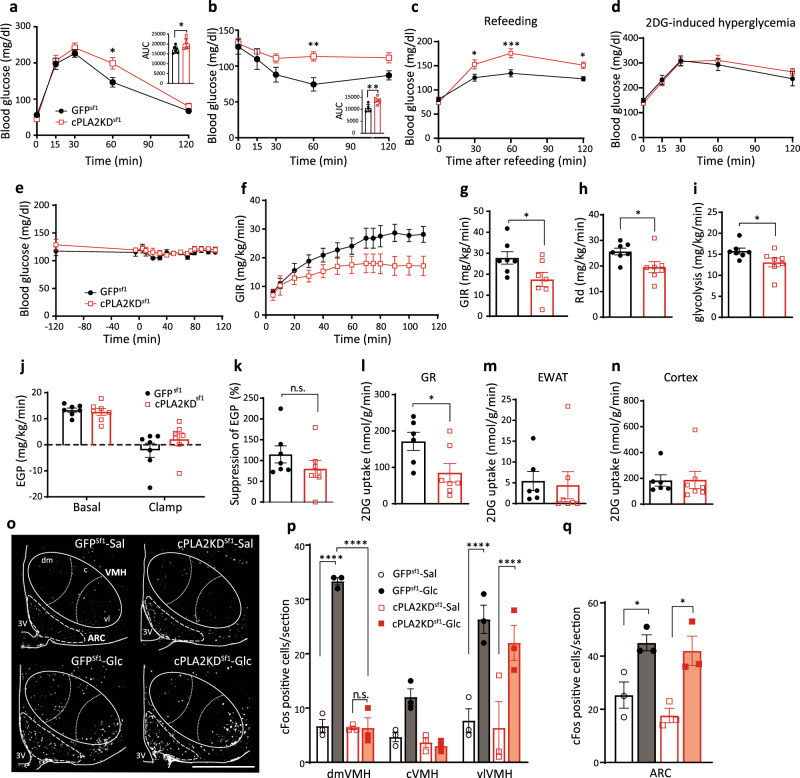
Fig. 3. Knockdown of Sf1-neuronal pla2g4a impairs systemic glucose metabolism.
a Glucose tolerance test in cPLA2KD Sf1 (n = 6) and GFPSf1 mice (n = 6; two-way ANOVA followed by Sidak multiple comparison test, p = 0.0126 at time = 60, cPLA2KDSf1 vs GFPsf1; two-tailed t test in area under the curve (AUC) during GTT, p = 0.0433, cPLA2KDSf1 vs GFPsf1). b Insulin tolerance test in cPLA2KDSf1 (n = 6) and GFPSf1 mice (n = 5; two-way ANOVA followed by Sidak multiple comparison test, p = 0.0094 at time = 60 cPLA2KDSf1 vs GFPsf1; two-tailed t test in AUC during GTT, p = 0.0071, cPLA2KDSf1 vs GFPsf1). c Blood glucose levels after refeeding in cPLA2KDSf1 (n = 6) and GFPSf1 mice (n = 9; two-way ANOVA followed by Sidak multiple comparison test, p = 0.0255 at time = 30, p = 0.0003 at time = 60, p = 0.0211 at time = 120, cPLA2KDSf1 vs GFPsf1). d 2-deoxy-glucose (2DG)-induced hyperglycemia in cPLA2KD Sf1 (n = 6) and GFPSf1 mice (n = 6). e–n Hyperinsulinemic–euglycemic clamp studies in cPLA2KDSf1 and GFPSf1 mice. e Blood glucose levels during hyperinsulinemic–euglycemic clamp studies in cPLA2KDSf1 or GFPSf1 mice. f The glucose infusion rate (GIR) required to maintain euglycemia during the clamp period in cPLA2KDSf1 (n = 7) or GFPSf1 mice (n = 7). g The average GIR between 75 and 115 min in cPLA2KDSf1 (n = 7) or GFPSf1 mice (n = 7; two-tailed t test, p = 0.0395, cPLA2KDSf1 vs GFPsf1). h The rate of glucose disappearance (Rd) during the clamp period, which represents whole-body glucose utilization (two-tailed t test, p = 0.0355, cPLA2KDSf1 vs GFPsf1). i The rates of whole-body glycolysis in cPLA2KDSf1 (n = 7) or GFPSf1 mice (n = 7; two-tailed t test, p = 0.0497, cPLA2KDSf1 vs GFPsf1). j Endogenous glucose production (EGP) during both the basal and clamp periods in cPLA2KDSf1 (n = 7) or GFPSf1 (n = 7). k Insulin-induced suppression of EGP, which represents hepatic insulin sensitivity in cPLA2KDSf1 (n = 7) or GFPSf1 (n = 7). l–n Graphs showing 2-[14C]-Deoxy-d-Glucose uptake in red portions of the gastrocnemius (GR; l), white adipocyte (EWAT; m) and brain (cortex; n) during the clamp period in cPLA2KDSf1 (n = 7) or GFPSf1 mice (n = 7; two-tailed t test, p = 0.0352 in l, cPLA2KDSf1 vs GFPsf1). o Representative micrographs showing immunofluorescent cFos staining in the hypothalamus of cPLA2KDSf1 and GFPSf1 mice after saline or glucose injection (3 g/kg). Scale bar: 500 μm. p, q Quantification of cFos expression in the dmVMH, cVMH, vlVMH, and ARC of cPLA2KDSf1 or GFPSf1 mice after saline (n = 3) or glucose (n = 3) injection (3 g/kg; VMH: two-way ANOVA followed by Sidak multiple comparison test, for dmVMH: p < 0.0001 GFPSf1 Sal vs GFPSf1 Glc, p < 0.0001 GFPSf1 Glc vs cPLA2KDSf1 Glc, for vlVMH: p < 0.0001 GFPSf1 Sal vs GFPSf1 Glc, p < 0.0001 cPLA2KDSf1 Sal vs cPLA2KDSf1 Glc. For ARC: one-way ANOVA followed by Sidak multiple comparison test, p = 0.0425 GFPSf1 Sal vs GFPSf1 Glc, p = 0.0174 cPLA2KDSf1 Sal vs cPLA2KDSf1 Glc.) All data represent the mean ± SEM; *p < 0.05; **p < 0.01; ***p < 0.001; ****p < 0.0001.

