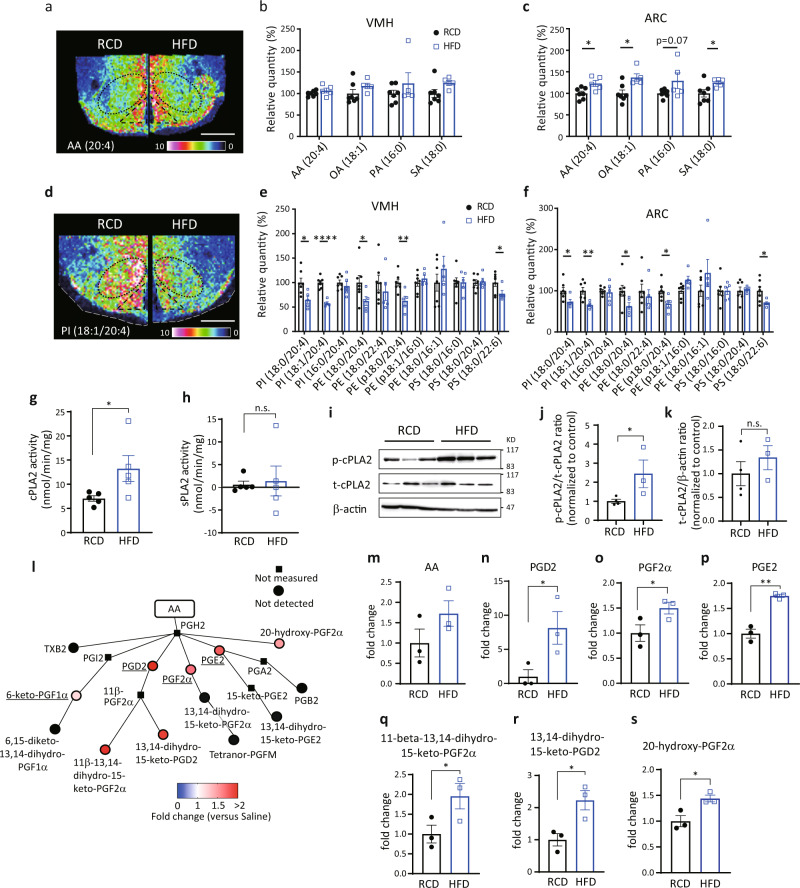
Fig. 4. HFD feeding increases prostaglandin production derived from phospholipids.
a–f Distributions of fatty acids and phospholipids in the hypothalamus in regular chew diet- (RCD-) or high-fat diet- (HFD-) fed mice for 8 weeks. a, d Representative results of IMS on hypothalamic arachidonic acid (AA) (a) and PI (18:1/20:4) (d) from RCD-fed mice (left) or HFD-fed mice (right). Scale bar: 500 μm. b, c Relative intensities of fatty acids in the VMH (b) or ARC (c) of RCD- (n = 7) or HFD-fed mice (n = 5; two-tailed t test for each molecule, ARC: p = 0.0190 in AA(20:4), p = 0.0104 in OA(18:1), p = 0.0387 in SA(18:0), RCD vs HFD). e, f Relative intensities of phospholipids in the VMH (e) or ARC (f) of RCD- (n = 7) or HFD-fed (n = 5) mice (two-tailed t test for each molecule, for VMH: p = 0.0196 in PI (18:0/20:4), p < 0.0001 for PI (18:1/20:4), p = 0.0362 for PE (18:0/20:4), p = 0.0080 for PE (p18:0/20:4), p = 0.0307 for PS (18:0/22:6), for ARC: p = 0.0325 for PI (18:0/20:4), p = 0.0061 for PI (18:1/20:4), p = 0.0282 for PE (18:0/20:4), p = 0.0192 for PE (p18:0/20:4), and p = 0.0347 for PS (18:0/22:6)). g, h Enzymatic activity of hypothalamic cPLA2 (g) and sPLA (h) in RCD- (n = 5) or HFD-fed (n = 5) mice (two-tailed t test, p = 0.0264 in g, RCD vs HFD). i–k Relative amount of total-cPLA2 (t-cPLA2) and phosphorylated-cPLA2 (p-cPLA2) between RCD and HFD-fed mice. i Representative photos of western blotting. j, k Quantification of p-cPLA2 (j) and t-cPLA2 (k) between RCD (n = 4) and HFD (n = 3) fed mice (two-tailed t test, p = 0.0338 in j, RCD vs HFD). l Relative amounts of prostaglandins in the hypothalamus after 8 weeks in HFD-fed mice (n = 3) compared with those of RCD-fed mice (n = 3). Major prostaglandins were underlined. m–s Bar graphs showing COX-mediated production of AA (m), PGD2 (n), PGF2α (o), PGE2 (p), 11-beta-13,14-dihydro-15-keto-PGF2α (q), 13,14-dihydro-15-keto-PGD2 (r), and 20-hydroxy-PGF2α (s) in 8 weeks of HFD-fed mice (n = 3) compared with RCD-fed mice (n = 3; two-tailed t test, p = 0.0256 in n, p = 0.0339 in o, p = 0.0013 in p, p = 0.0354 in q, p = 0.0260 in r, p = 0.0250 in s, RCD vs HFD). All data represent the mean ± SEM; *p < 0.05; **p < 0.01; ***p < 0.001; ****p < 0.0001.

