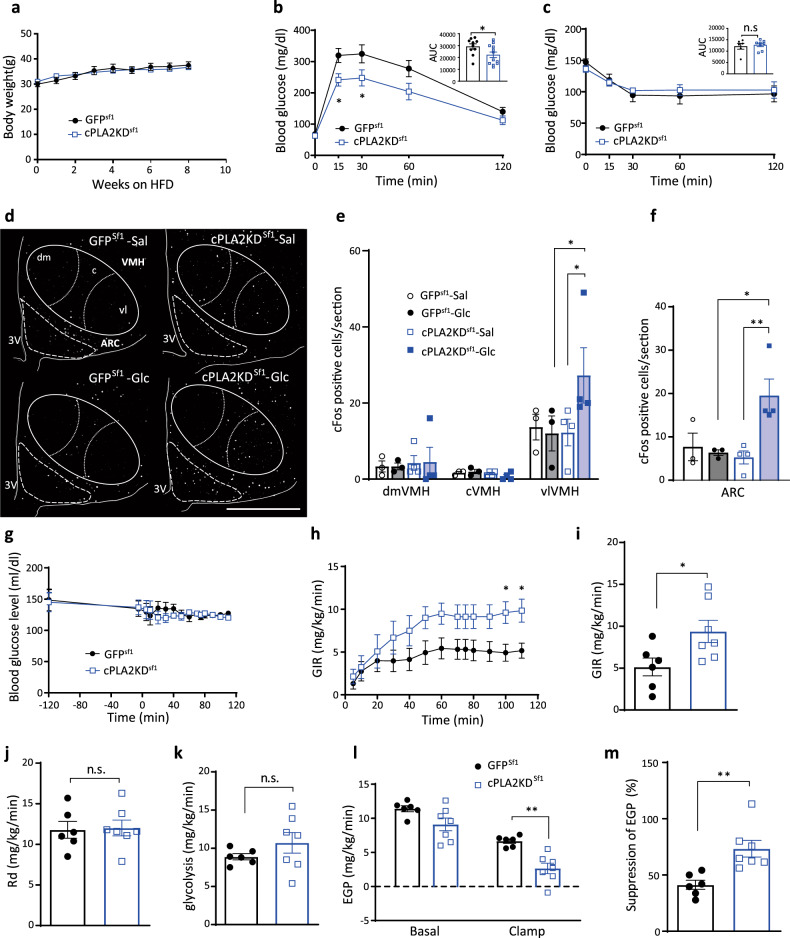
Fig. 5. Knockdown of cPLA2 improves HFD-induced impairment of glucose metabolism.
a Body weight change in cPLA2KDSf1 mice (n = 12) and GFPSf1 mice (n = 11). b Glucose tolerance test on cPLA2KDSf1 mice (n = 12) and GFPSf1 mice (n = 10; two-way ANOVA followed by Sidak multiple comparison test, p = 0.0415 at time = 15, p = 0.0482 at time = 30, cPLA2KDSf1 vs GFPsf1; two-tailed t test in area under the curve (AUC) during GTT, p = 0.0428, cPLA2KDSf1 vs GFPsf1). c Insulin tolerance test on cPLA2KDSf1 (n = 8) mice and GFPSf1 mice (n = 6) during 8 weeks of HFD feeding. d Representative micrographs showing immunofluorescent cFos staining in the hypothalamus of HFD-fed cPLA2KDSf1 and GFPSf1 mice after saline or glucose injection. Scale bar: 500 μm. e, f Quantification of cFos expression in the dmVMH, cVMH, vlVMH (e) and ARC (f) of HFD-fed cPLA2KDSf1 or GFPSf1 mice after saline or glucose injection (n = 3–4 in each experimental group; VMH: two-way ANOVA followed by Sidak multiple comparison test. for vlVMH: p = 0.0231 cPLA2KDSf1 Sal vs cPLA2KDSf1 Glc, p = 0.014 GFPSf1 Glc vs cPLA2KDSf1 Glc. For ARC: one-way ANOVA followed by Sidak multiple comparison test, p = 0.0176 cPLA2KDSf1 Sal vs cPLA2KDSf1 Glc, p = 0.0444 GFPSf1 Glc vs cPLA2KDSf1 Glc). g–m Hyperinsulinemic–euglycemic clamp studies in HFD-fed cPLA2KDSf1 (n = 7) or GFPSf1 (n = 7) mice. g Blood glucose levels during hyperinsulinemic–euglycemic clamp studies in HFD-fed cPLA2KDSf1 (n = 7) or GFPSf1 (n = 7) mice. h The glucose infusion rate (GIR) required to maintain euglycemia during the clamp period in cPLA2KDSf1 (n = 7) or GFPSf1 (n = 6) mice. i The average GIR between 75 and 115 min in cPLA2KDSf1 (n = 7) or GFPSf1 (n = 6) mice (two-tailed t test, p = 0.0324, cPLA2KDSf1 vs GFPSf1). j The rate of glucose disappearance (Rd) during the clamp period, which represents whole-body glucose utilization. k The rates of whole-body glycolysis in cPLA2KDSf1 or GFPSf1 mice. l Endogenous glucose production (EGP) during both basal and clamp periods in cPLA2KDSf1 or GFPSf1 mice. m The percent-suppression levels of EGP induced by insulin infusion, which represents hepatic insulin sensitivity in cPLA2KDSf1 (n = 7) or GFPSf1 (n = 6) mice (two-tailed t test, p = 0.0038, cPLA2KDSf1 vs GFPSf1). All data represent the mean ± SEM; *p < 0.05; **p < 0.01.

