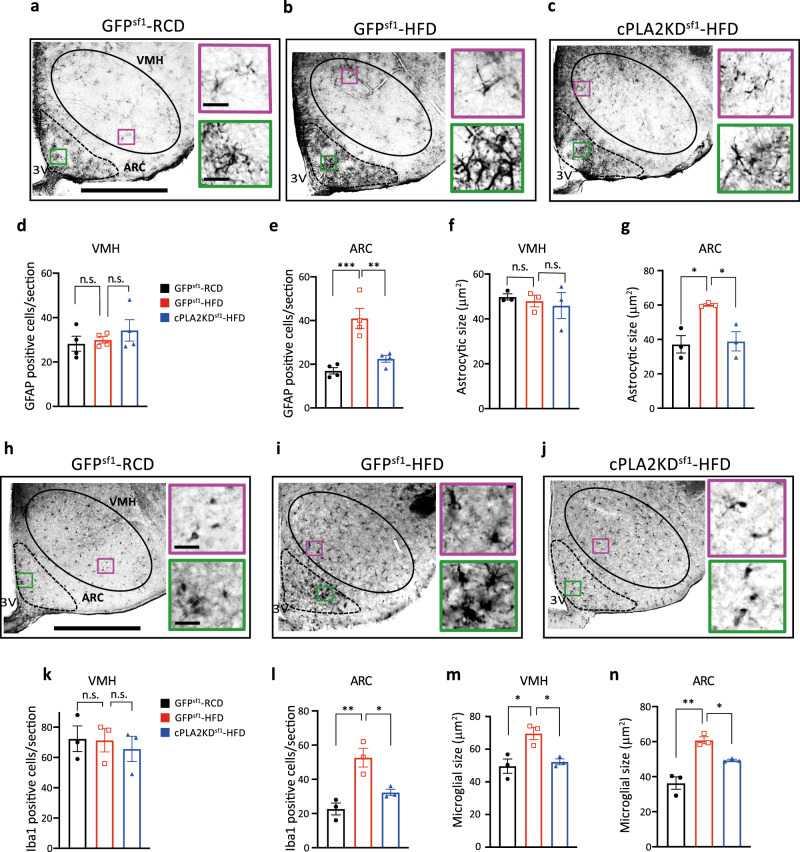
Fig. 6. Knockdown of cPLA2 prevents HFD-induced microgliosis and astrogliosis.
a–c Left: representative micrographs showing immunochemistry GFAP staining in the hypothalamus of RCD-fed GFPSf1 mice (GFPSf1-RCD) (a), HFD-fed GFPSf1 mice (GFPSf1-HFD) (b), and HFD-fed cPLA2KDSf1 (cPLA2KDSf1-HFD) mice (c). Scale bar: 500 μm. Right: magnified areas in the VMH and ARC in the left. Scale bar: 30 μm. d,e, Quantification of GFAP-positive cells in the VMH (d) or ARC (e) of GFPSf1-RCD (n = 4), GFPSf1-HFD (n = 4) and cPLA2KDSf1-HFD (n = 4) mice (one-way ANOVA followed by Sidak multiple comparison test, in e, p = 0.0007 GFPSf1 RCD vs GFPSf1 HFD, p = 0.0045 GFPSf1 HFD vs cPLA2KDSf1 HFD). f,g, Size of GFAP-positive cells in in the VMH (f) or ARC (g) of GFPSf1-RCD (n = 3), GFPSf1-HFD (n = 3), and cPLA2KDSf1-HFD (n = 3) mice (one-way ANOVA followed by Sidak multiple comparison test, in g, p = 0.0002 GFPSf1 RCD vs GFPSf1 HFD, p = 0.0012 GFPSf1 HFD vs cPLA2KDSf1 HFD). h–j Left: Representative micrographs showing immunochemistry Iba1 staining in the hypothalamus of GFPSf1-RCD (h), GFPSf1-HFD (i) and cPLA2KDSf1-HFD mice (j). Scale bar: 500 μm. Right: magnified areas in the VMH and ARC from the left photos. Scale bar: 30 μm. k, l Quantification of Iba1-positive cells in the VMH (k) or ARC (l) of GFPSf1-RCD (n = 3), GFPSf1-HFD (n = 3), and cPLA2KDSf1-HFD (n = 3) mice (one-way ANOVA followed by Sidak multiple comparison test, in l, p = 0.0049 GFPSf1 RCD vs GFPSf1 HFD, p = 0.0310 GFPSf1 HFD vs cPLA2KDSf1 HFD). m, n Size of Iba1-positive cells in the VMH (m) or ARC (n) of GFPSf1-RCD (n = 3), GFPSf1-HFD (n = 3), and cPLA2KDSf1-HFD (n = 3) mice (one-way ANOVA followed by Sidak multiple comparison test, in m, p < 0.0001 GFPSf1 RCD vs GFPSf1 HFD, p = 0.0004 GFPSf1 HFD vs cPLA2KDSf1 HFD, in n, p < 00001 GFPSf1 RCD vs GFPSf1 HFD, p = 0.0004 GFPSf1 HFD vs cPLA2KDSf1). All data represent the mean ± SEM; *p < 0.05; **p < 0.01; ***p < 0.001.

