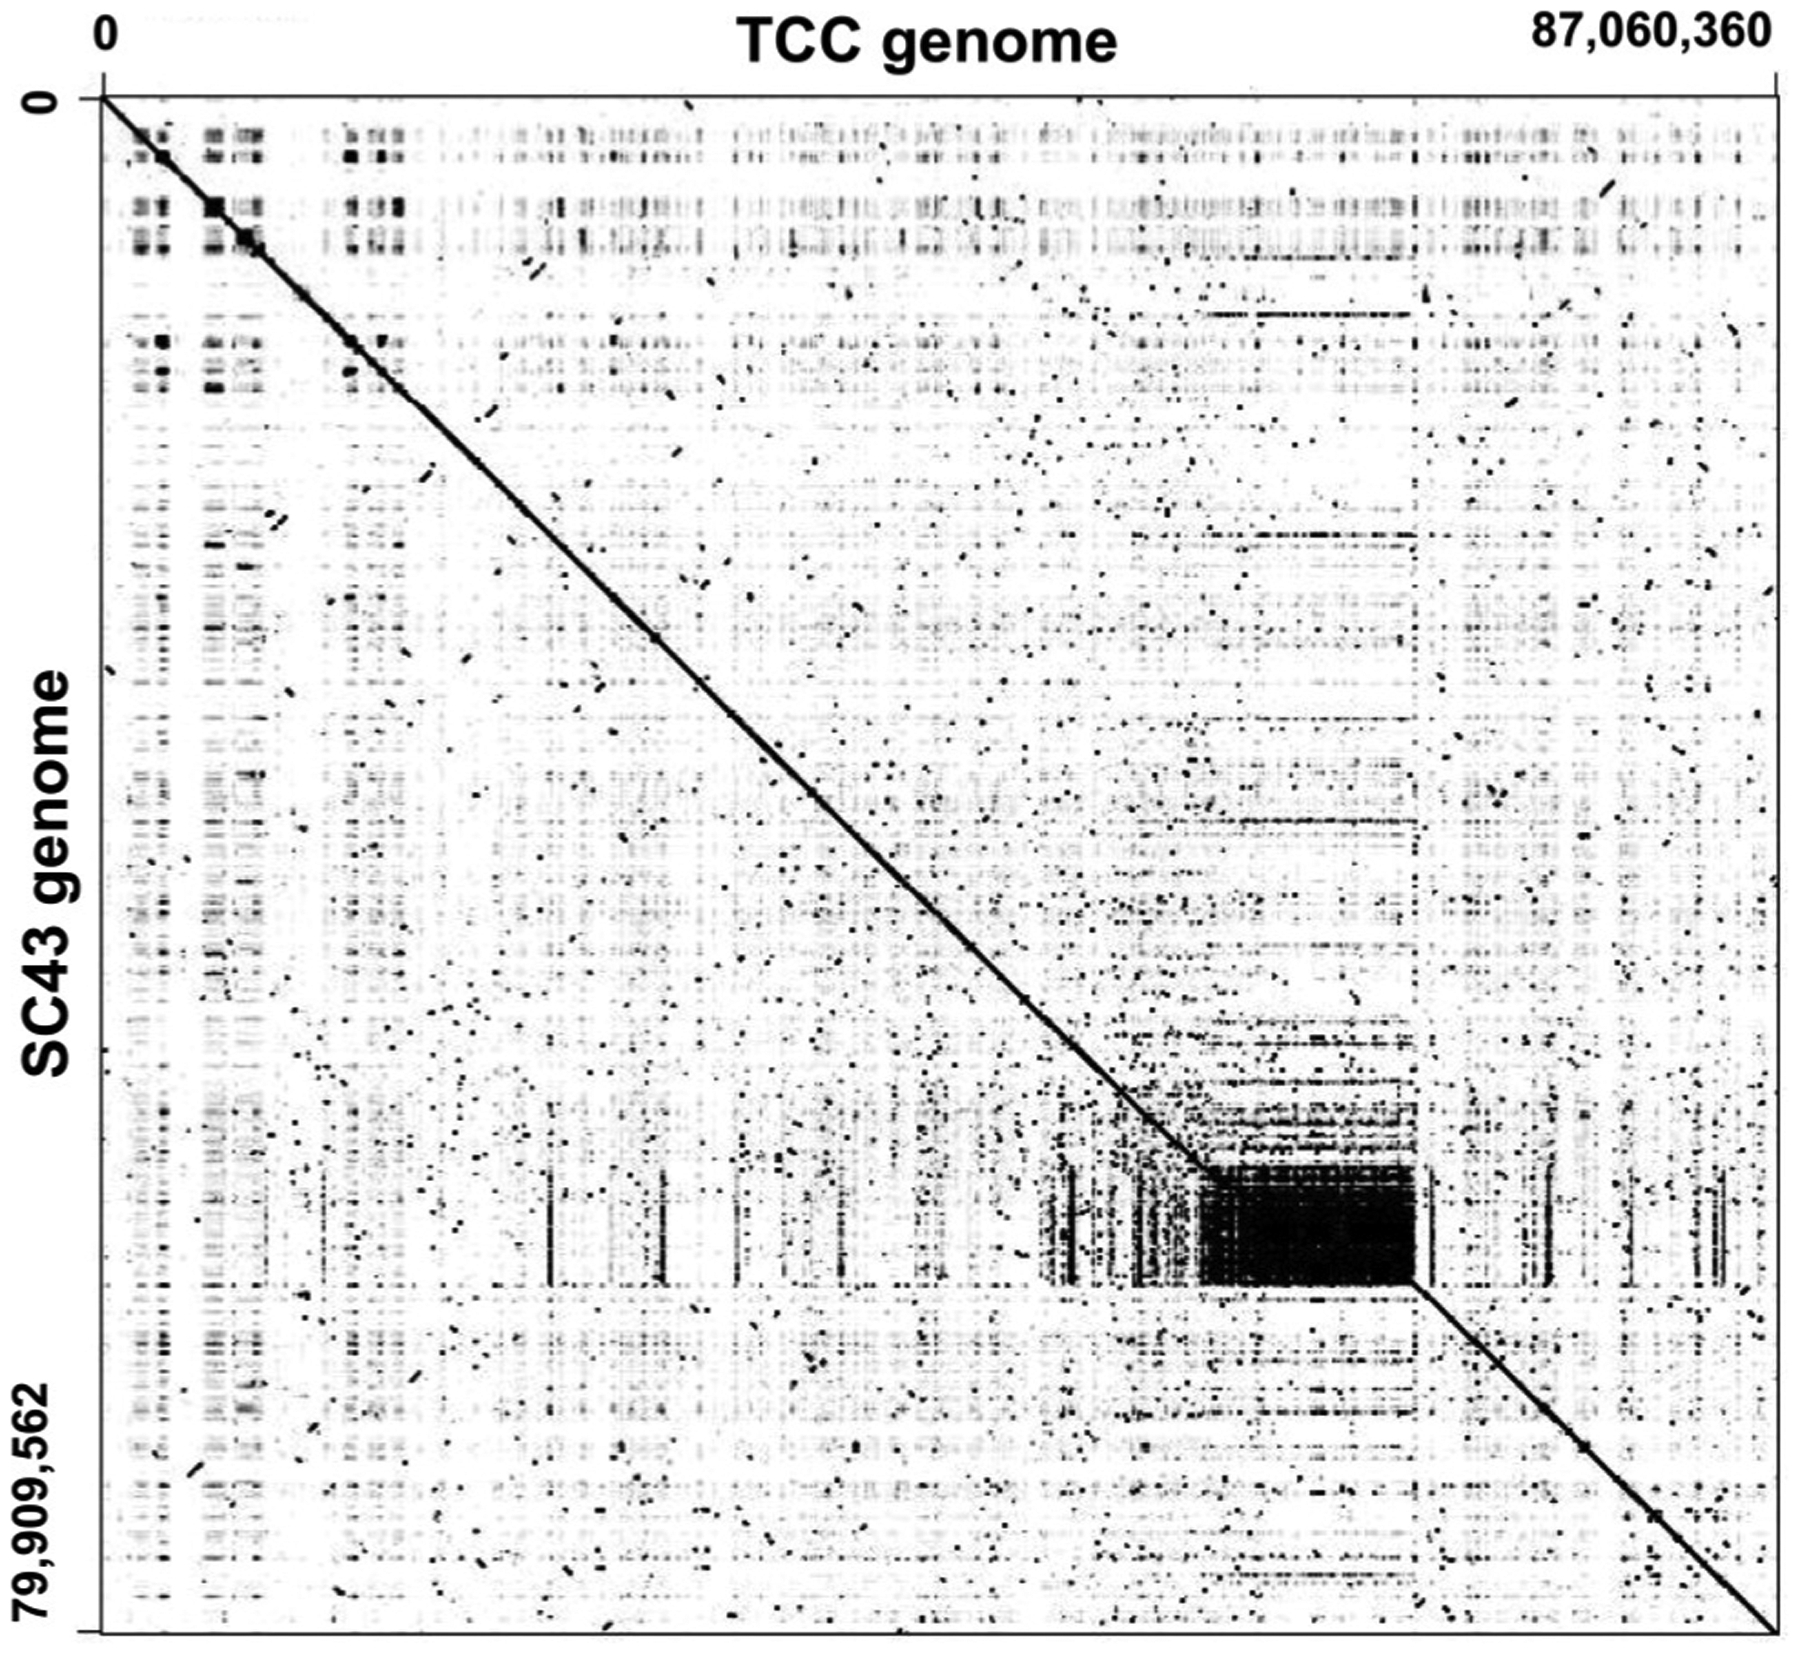
Fig. 1.

Dot plot comparison of SC43cl1.1 and TCC genomes. SC43cl1.1 contigs were concatenated (79 Mbp) and compared with the concatenated genome of the TCC strain (87 Mbp) to assess overall synteny using a dot plot. Note extensive synteny over the entire genome.
