
Figure 2.
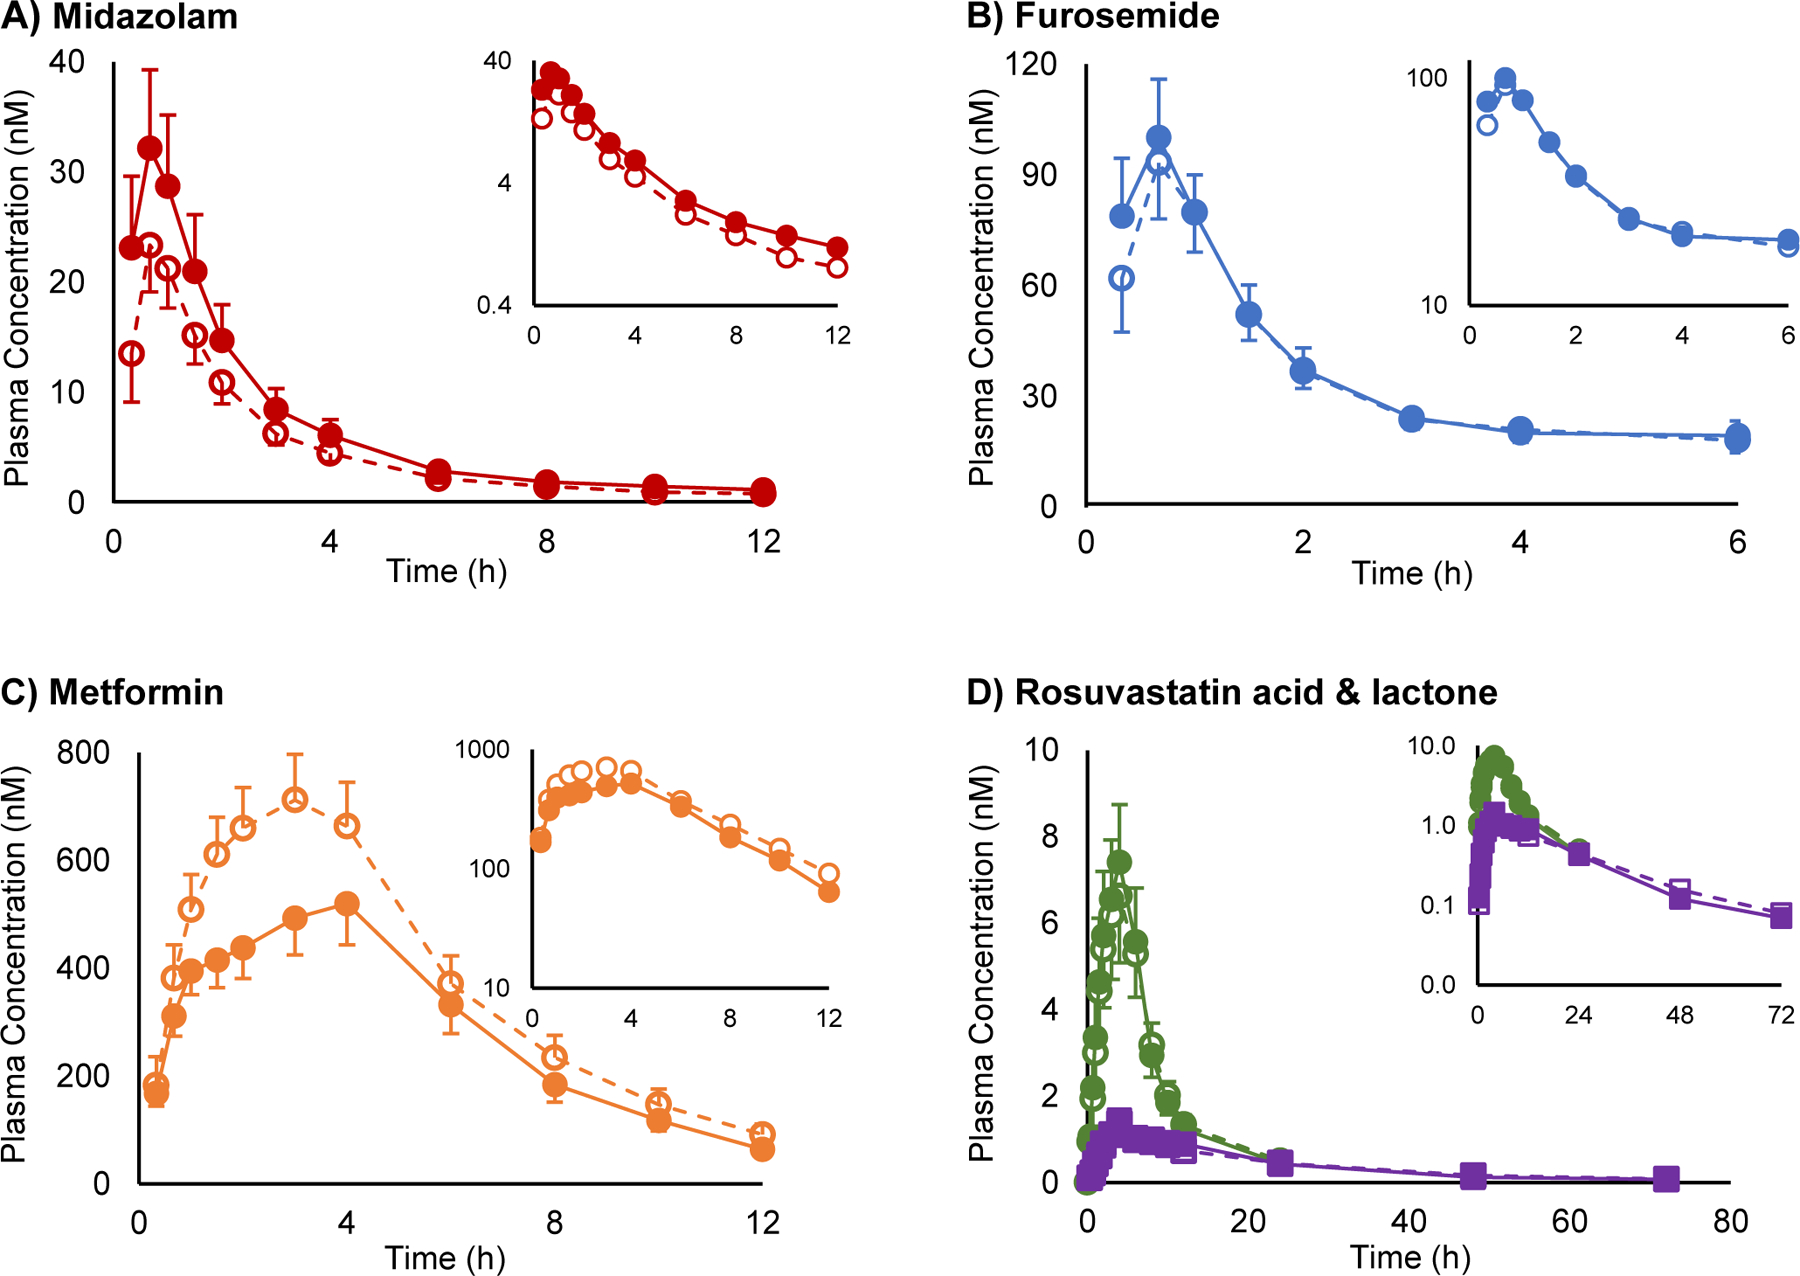
Plasma concentration vs. time profiles for (A) midazolam, (B) furosemide, (C) metformin, and (D) rosuvastatin acid (●) and rosuvastatin lactone (■) following oral administration to 16 healthy volunteers alone (open symbols) or upon five-day exposure to oral goldenseal (solid symbols). Symbols and error bars denote geometric means and 90% confidence intervals, respectively.