
Figure 3.
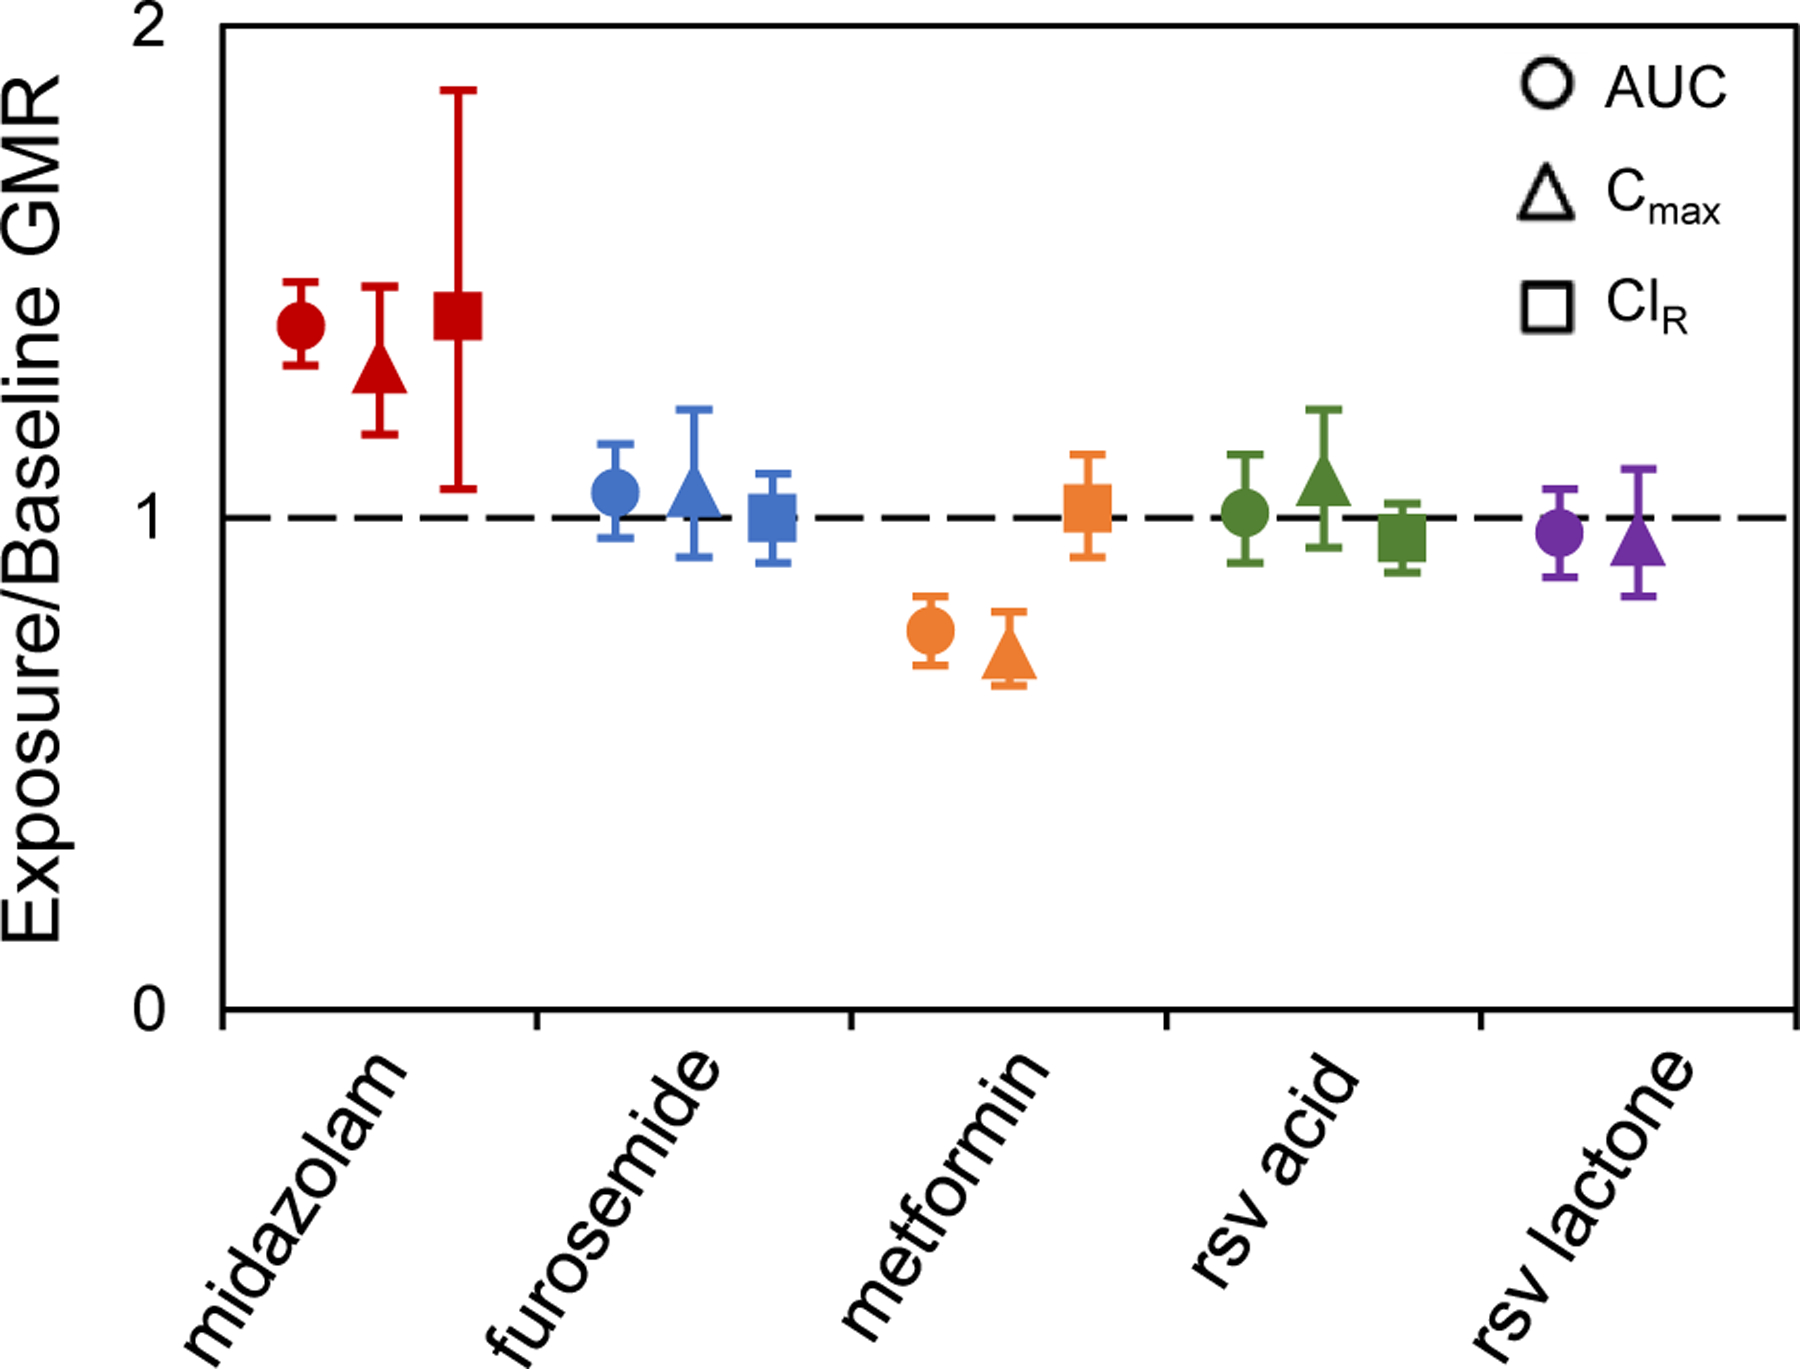
Goldenseal exposure-to-baseline geometric mean ratios (GMRs), with 90% confidence intervals, of the area under the plasma concentration-time curve (AUC), maximum concentration (Cmax), and renal clearance (ClR) for each probe substrate. The AUC ratios for furosemide, rosuvastatin (rsv) acid, and rsv lactone were calculated using plasma concentration-time curves up to the last quantifiable time point (AUC0-last), whereas AUC ratios for midazolam and metformin were calculated using plasma concentration-time curves to time infinity (AUC0-inf). ■ – midazolam; ■ – furosemide; ■ – metformin; ■ – rsv acid; ■ – rsv-lactone.