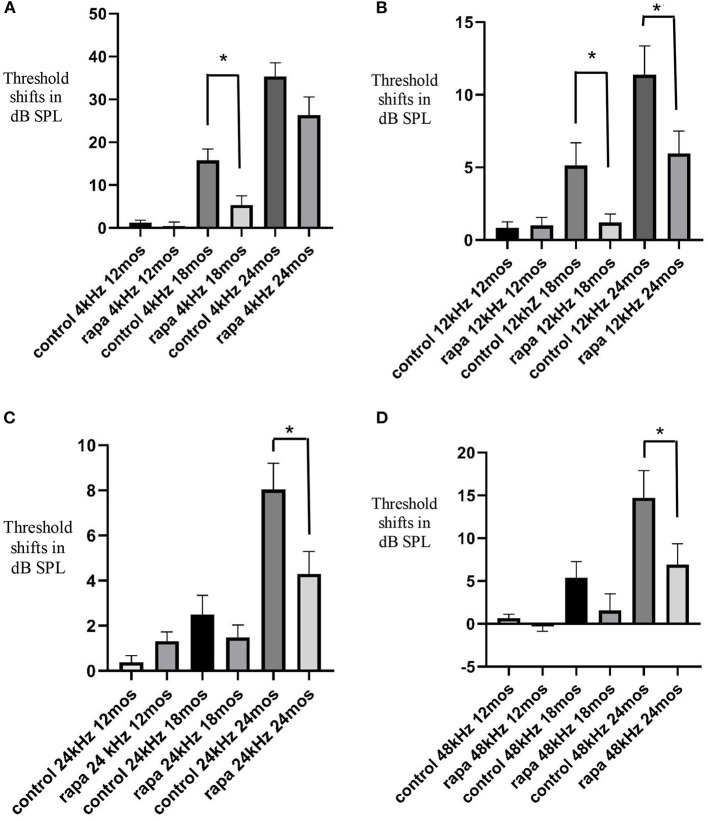
Figure 1.
Comparison of mean auditory brain stem response threshold shifts (compared to 5 months of age) in the group with rapamycin added to diet at 14 months of age (rapa) vs. the group on control diet without rapamycin (control) at 12, 18, and 24 months of age at 4 kHz (A), 12 kHz (B), 24 kHz (C) and 48 kHz (D). Asterisks indicate significant differences. Please note differences between A, B, C, and D in scale bars for dB SPL on the “y” axis.

