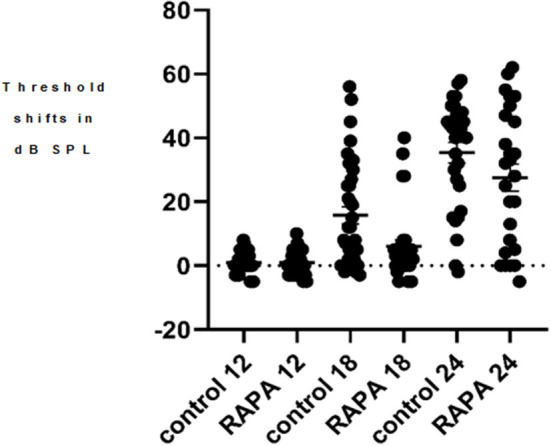
Figure 2.

A scatter plot of the 4 kHz auditory brain stem response threshold shifts (compared to 5 months of age) at 12, 18, and 24 months of age in the control diet group (without rapamycin) and in the group with rapamycin added to diet at 14 months of age. There is little variability in either group at 12 months of age. At 18 months of age more variability is seen in the control diet group (control 18) while the rapamycin treatment group (RAPA18) remains more skewed toward little threshold shift. At 24 months of age there is less variability in the control group (control 24) now skewed toward large threshold shifts while the rapamycin treatment group (RAPA24) has more distribution across the range of threshold shifts.
