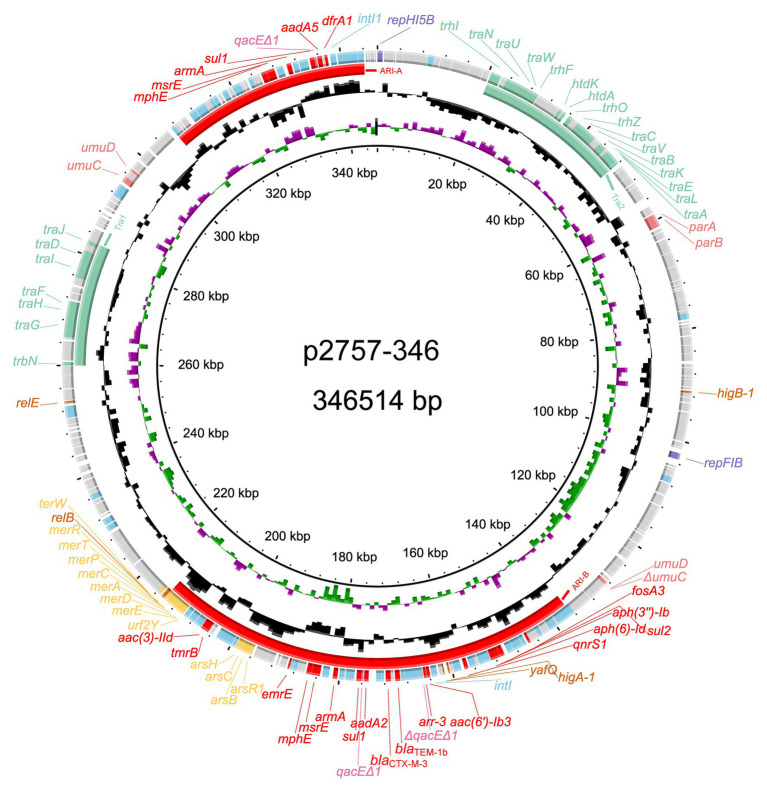
Figure 1.
Schematic diagram of the p2757-346 plasmid. The various colors indicate different gene functions, including replication (in purple), transfer (in green), maintenance (in pink), and resistance (in red), and mobile elements (in blue). The circles show (from outside to inside) predicted coding sequences, the GC content, the GC skew, and the scale (in kilobases).

