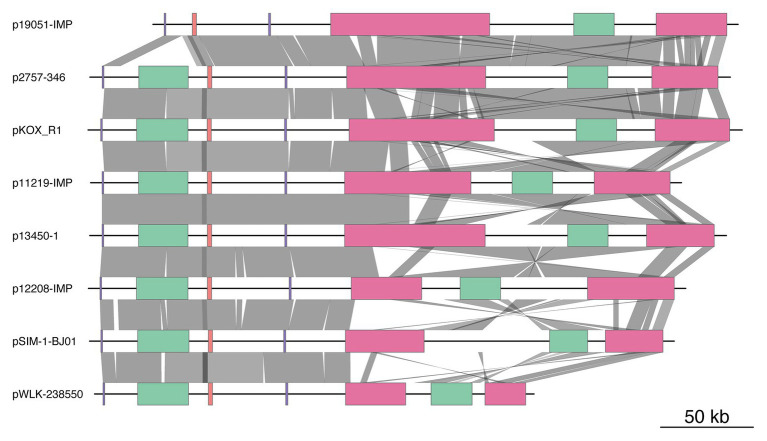
Figure 2.
Comparison of the genome structure of eight plasmids. The color-coded boxes indicate different gene functions, including replication (in purple), plasmid transfer (in green), plasmid partition (in pink), and antibiotic resistance island (ARI; in red). Orthologous regions are connected and color coded. The plasmids and their accession numbers are p2757-346 (CP060810), pWLK-238,550 (CP038277), p13450-1 (CP026014), pSIM-1-BJ01 (MH681289), p19051-IMP (MF344565), p12208-IMP (MF344562), p11219-IMP (MF344561), and pKOX_R1 (CP003684). The shading indicates 90% nucleotide sequence identity.

