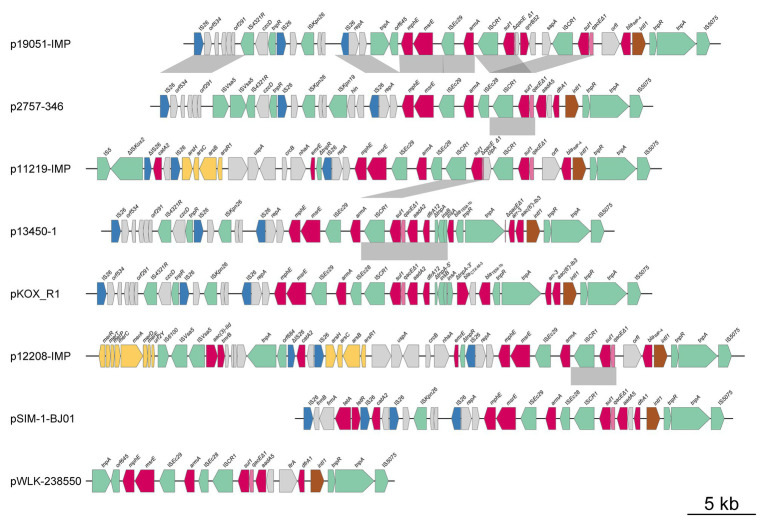
Figure 4.
Comparative genomic analysis of antibiotic resistance island A (ARI-A). Mobile elements are shown by green, brown, and blue arrows. The red arrows indicate antibiotic resistance genes, the pink arrows denote biocide resistance genes, and the gray arrows represent genes of other functions. The shading indicates 100% nucleotide sequence identity.

