
Figure 11.
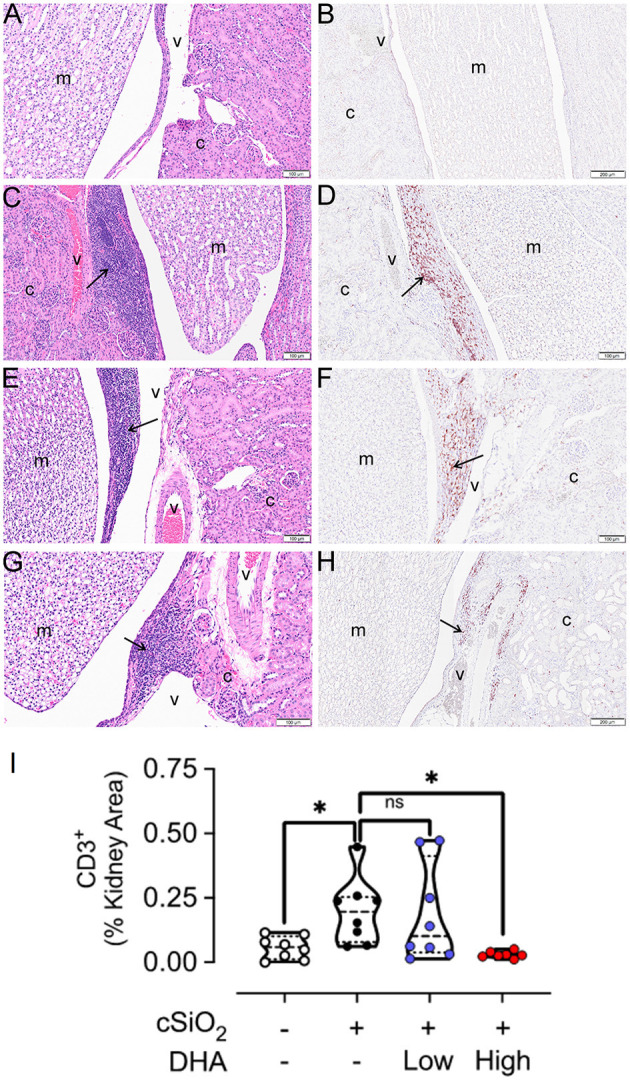
High DHA diet suppresses cSiO2-induced CD3+ T cell infiltration into the kidney. Light photomicrographs of hematoxylin and eosin-stained renal tissue sections (A,C,E,G) from the hilar region and light photomicrographs of kidney tissue sections immunohistochemically stained (arrows) for CD3+ T cells (B,D,F,H). Kidneys taken from mice at 13 weeks after the final intranasal saline intranasal instillation and fed control diet (Veh/CON, A,B), cSiO2 instillation and fed control diet (cSiO2/CON, C,D), cSiO2 instillation and fed 0.4% DHA diet (cSiO2/low DHA, E,F), and cSiO2 instillation and fed 1.0% DHA diet (cSiO2/high DHA, G,H).Lymphoid cell accumulations (arrows) in the interstitial tissue adjacent to interlobular blood vessels (v) in the renal cortex (c) (C,E,G)). Marked perivascular accumulation of lymphoid cells in the renal cortex (c) from cSiO2/CON mouse (C). Moderate, mild and no perivascular accumulations of lymphoid cells in the kidneys of cSiO2/low DHA (E), cSiO2/high DHA (G), and Veh/CON (A) mice, respectively. Marked perivascular accumulation of CD3+ T cells (arrows) in kidney of cSiO2/CON mouse (D). Moderate, minimal and no perivascular accumulations of T lymphoid cells in the kidneys of cSiO2/low DHA (F), cSiO2/high DHA (H), and Veh/CON (B) mice, respectively. m, medulla of the renal papilla that extends into the renal pelvis. (I) depicts the percentage of CD3+ renal tissue. Statistical comparisons were performed as described in the Methods section. *p ≤ 0.05, ns = not significant.