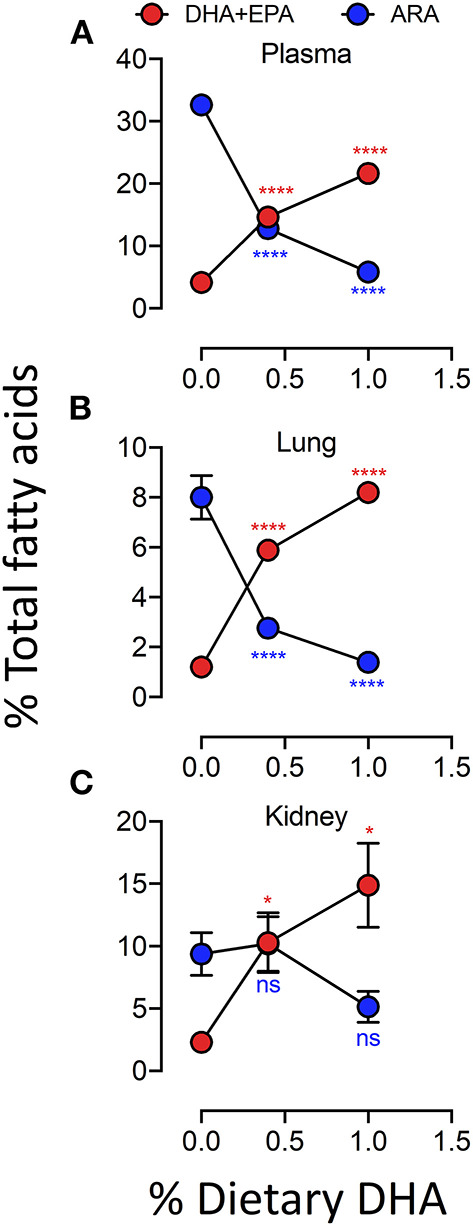
Figure 3.

Experimental diets influence the DHA and ARA concentrations in kidney, lung and plasma. Incorporation of EPA and DHA in the plasma (A) and tissues (B,C) increased in a dose-dependent manner that coincided with a reduction in ARA. Data presented as mean ± SEM. Fatty acid levels from animals fed the low-and high-DHA diets were compared to animals fed the CON diet. Statistical comparisons were performed as described in the Methods section. *p < 0.05, ****p < 0.0001, ns = not significant. Asterisk/text color corresponds to fatty acid data being analyzed (ARA, red; EPA+DHA, blue).
