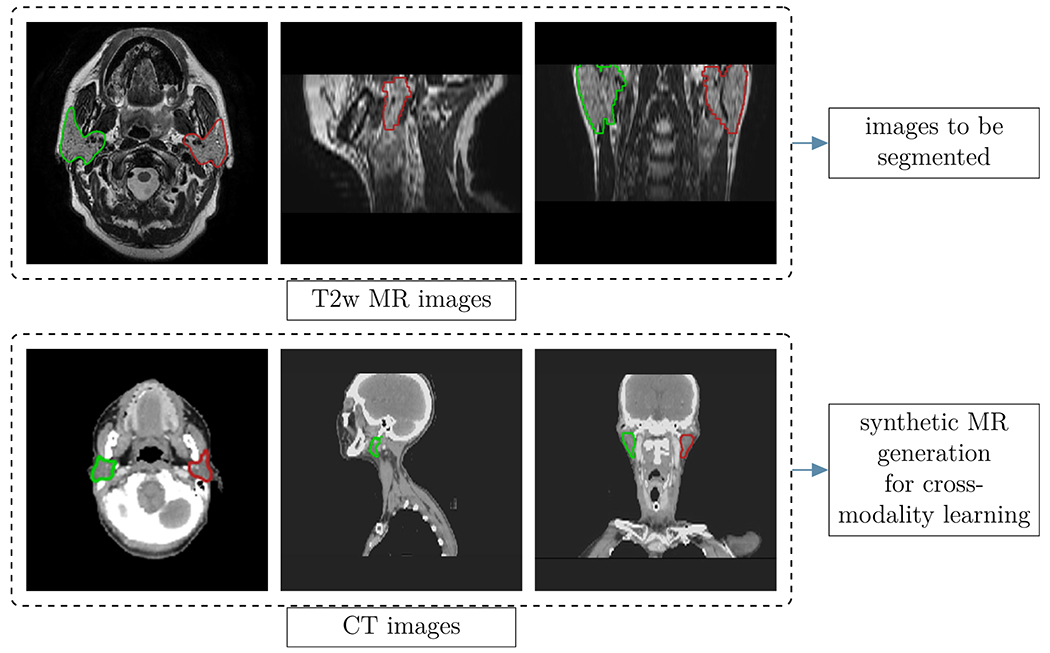
Fig 1.

Examples of images used in this study: Axial, coronal and sagittal views of the T2w MR (top row) and the CT images (bottom row). The colored regions represent the manually segmented regions of interest of the left (red) and right (green) parotids. The CT images were downloaded from the publicly available database of the Cancer Imaging Archive,34 as well as the MICCAI head and neck cancer segmentation challenge.35
