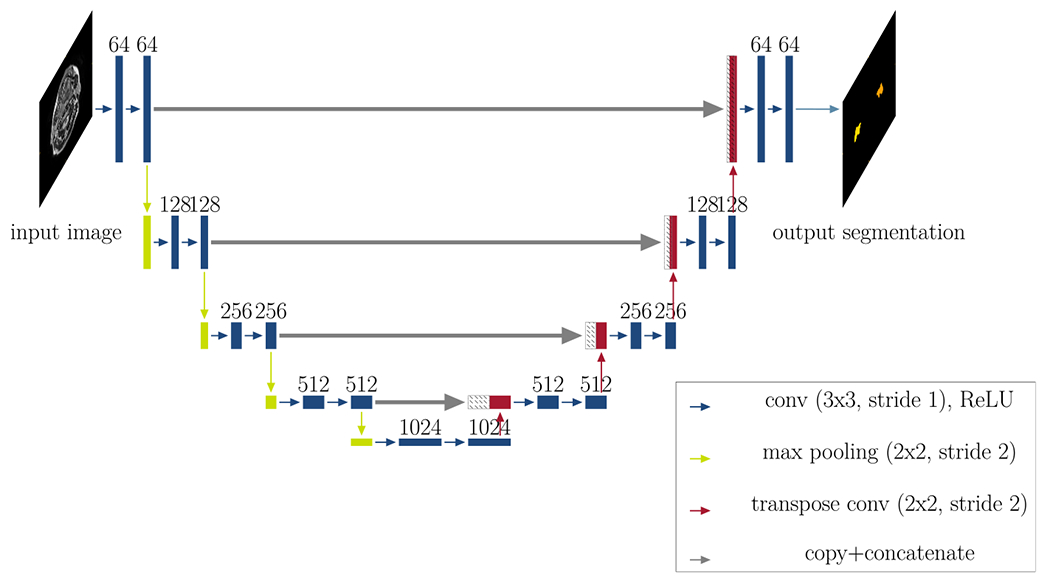
Fig 5.

Network architecture: This figure illustrates the architecture of the segmentation network (2D U-Net with five resolution levels, starting at 64 features and ending at 1024 features at the lowest resolution in the bottleneck). Each rectangle corresponds to a feature map. The feature channels are denoted at the top of the rectangles. Striped boxes represent copied feature maps. The colored arrows denote the different operations as indicated in the legend. The output for all three approaches is a 2D segmentation map.
