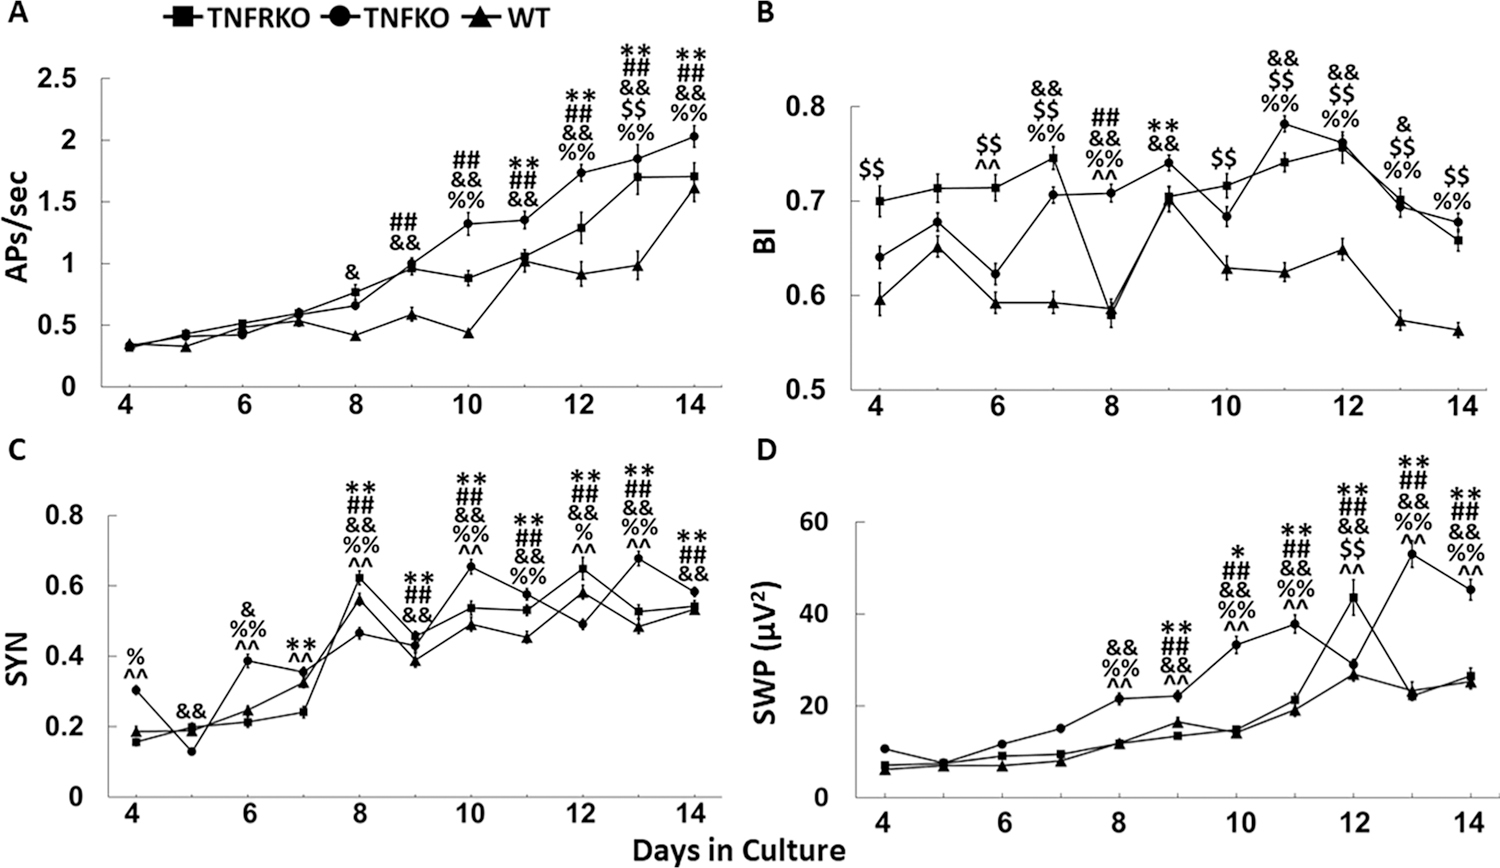
Fig. 2.

Development of spontaneous electrical activity in somatosensory cortex neuronalglial co-cultures. Cultures were derived from wildtype (WT), double tumor necrosis factor receptor (TNFR1, /TNFR2) knockout mice (TNFRKO), and TNFKO mice. Numbers of preparations, MEAs, wells and electrodes are presented in Table 1. For each strain and parameter, mean values ± standard errors from day (D)4-D14 in cell culture are presented in the figure. In some cases, SE values are so small they are imperceptibly confined within the data points. A. Average values for action potentials per second (APs/sec) are shown. B. Mean burstiness indices (BI) are shown. C. Average synchronization (SYN) values between adjacent electrodes are shown. D. Mean fast Fourier transformation values (slow wave power (SWP; µV2) within the 0.25–3.75 Hz frequency band values are shown. To determine development changes of values on D5-D14, each day’s values were compared to D4 values within each strain for each sleep parameter. One-way ANOVA analyses were followed by post-hoc Tukey’s HSD tests if significant (p < 0.05) main effects were found: WT, *p < 0.05, **p < 0.01; TNFRKO, ##p < 0.01; TNFKO, &p < 0.05, &&p < 0.01; To determine day, strain and day by strain interaction differences for each sleep parameter, two-way ANOVA analyses were used, followed by post-hoc Tukey’s HSD tests if significant (p < 0.05) effects were found: WT vs TNFRKO, $ $p < 0.01; WT vs TNFKO, %p < 0.05, %%p < 0.01; TNFRKO vs TNFKO, ^^p < 0.01.
