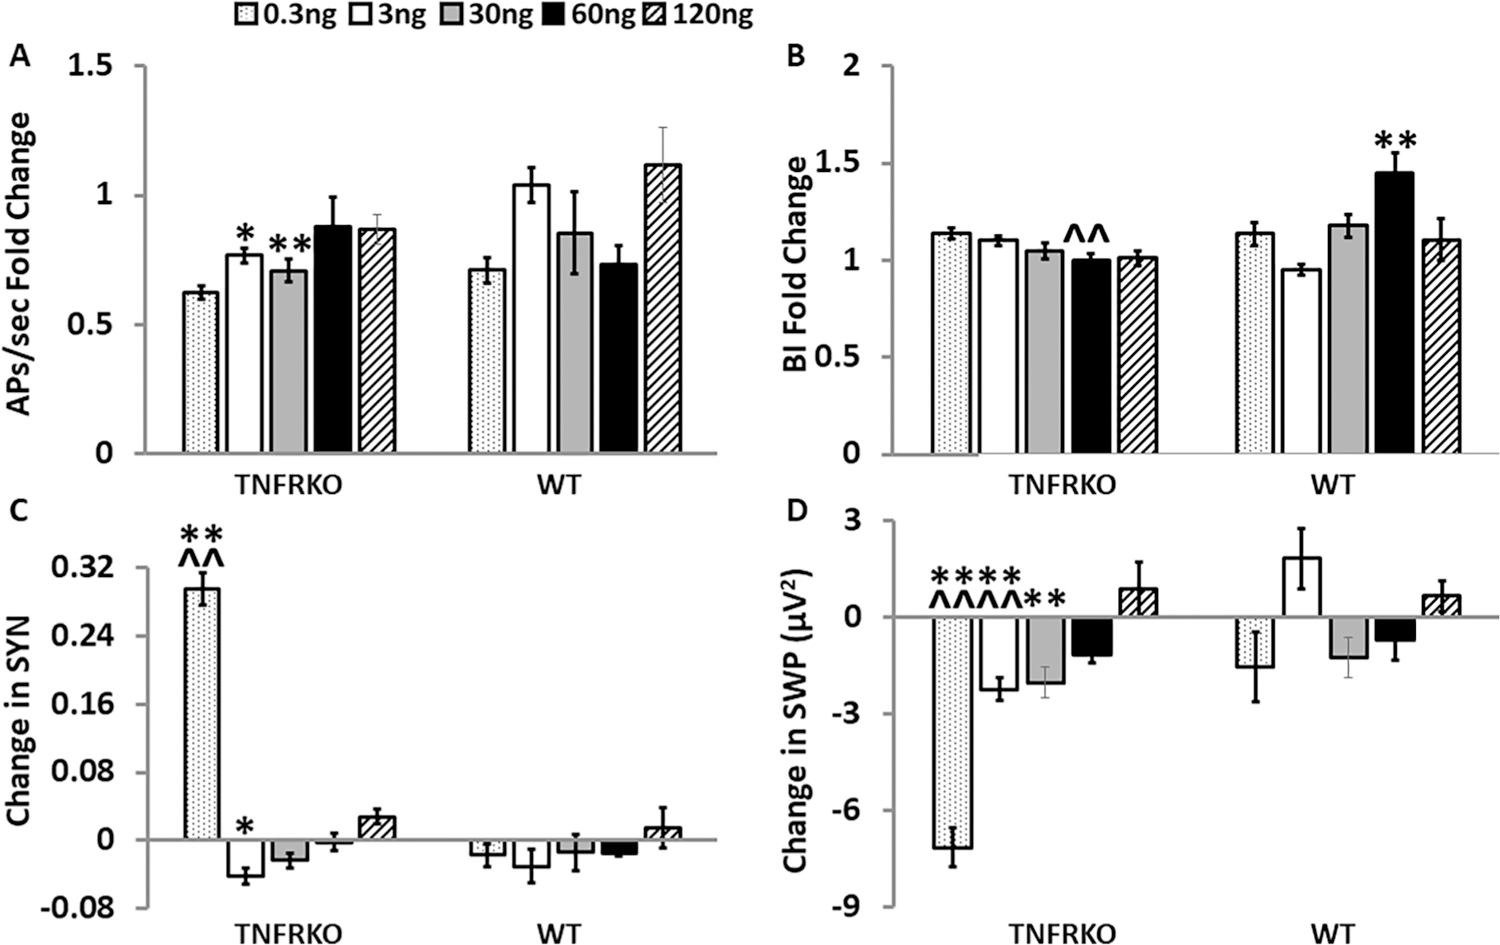
Fig. 3.

Addition of the soluble tumor necrosis factor receptor 1 (TNFR1) on day 14 altered electrophysiological parameters in a dose- and strain-dependent manner in cells from mice lacking both TNFRs (TNFRKO) mice and cells from wildtype (WT) mice. For each sTNFR1 treatment dose (0.3 ng/µL, 3 ng/µL, 30 ng/µL, 60 ng/µL, and 120 ng/µL) within each strain and parameter, graphically presented values are means ± standard errors of normalized fold changes (APs/sec and BI) and differences (SYN and SWP) relative to the control treatment dose. Changes in each measure were compared first to their respective day 14 baseline values and then to the sTNFR1 control treatment change from baseline mean within the same MEA and strain as described in the methods section. Numbers of preparations, MEAs, wells and electrodes are presented in Table 1. A. Normalized fold change values of action potentials per second (APs/sec). B. Normalized fold change of burstiness index (BI). C. Change in synchrony (SYN) between electrodes. D. Change in slow wave power (SWP) (µV2, 0.25–3.75 Hz). Within strain, significance of dose-induced changes (p < 0.05) was determined by one-way ANOVA (dose) followed by post-hoc Tukey’s honestly significant differences (HSD) tests when significant main effects were found. Significant effects of dose, strain and dose by strain interactions were determined with two-way ANOVA (dose, strain, dose × strain), followed by post-hoc Tukey’s HSD tests when significant (p < 0.05) main effects were found. Within strain significant dose-induced changes compared with the control treatment: *p < 0.05, **p < 0.01. Within dose significant strain differences : ^^p < 0.01. Within strain significant differences between dose-induced changes (0.3 ng/µL, 3 ng/µL, 30 ng/µL, 60 ng/µL, and 120 ng/µL) are not shown in this figure but are reported in the results section.
