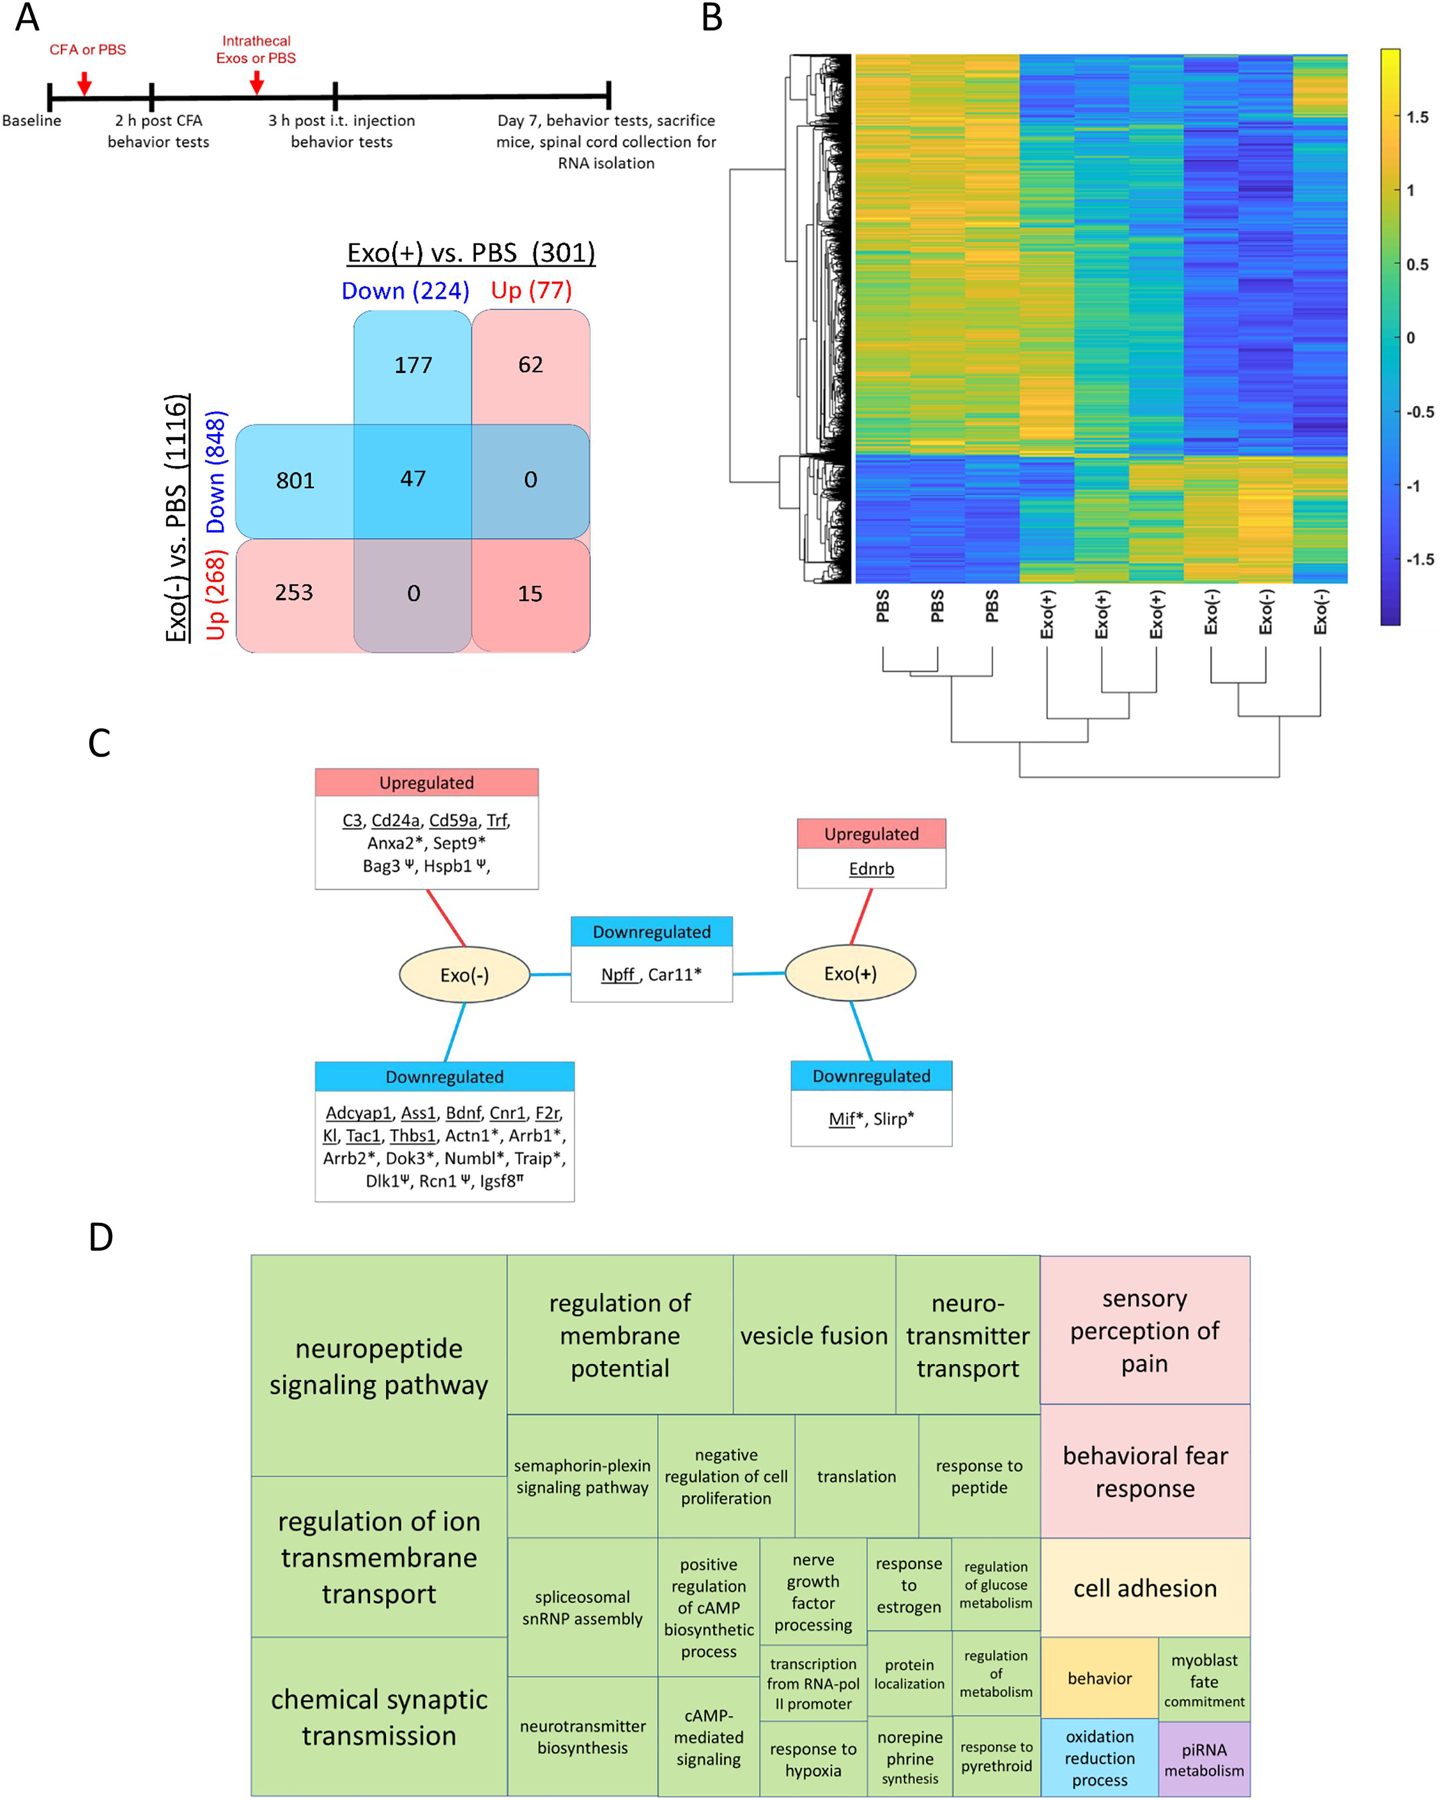
Fig. 8. Gene expression changes in dorsal horn of spinal cord following therapeutic administration of sEVs.

(A) Schematic representation of the experimental design and Venn diagram of differentially expressed genes (DEGs) in spinal cord at 7-days post-CFA treatment (n=3). (B) Gene clustering using single linkage of the Pearson correlation of log2-TPM values. (C) DEGs grouped by up- or down-regulation in Exo(−) and Exo(+) samples. GO:0006954 (underlined) and the DEGs whose protein products interact with Traf6*, Irak1 ψ, Pdcd4π are shown. (D) TreeMap of the Gene Ontology (GO) biological processes enriched with the DEGs.
