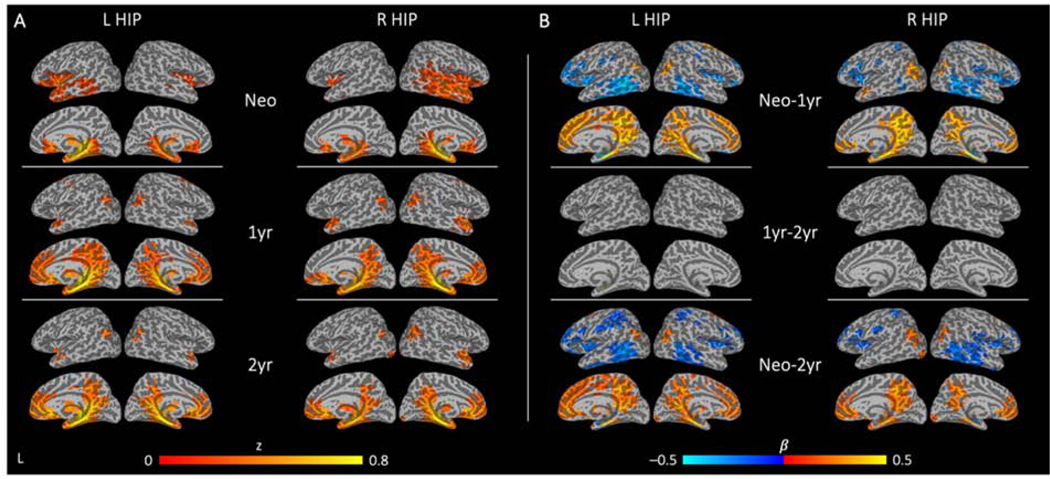
Figure 3. Regional functional connectivity and corresponding longitudinal changes for the left and right hippocampus.
Cross-sectional patterns of significant hippocampal functional connectivity are detected at all three time points (A). Patterns of significant changes in hippocampal connectivity over time show dramatic growth from neonate to 1 year, with minimal differences from 1 to 2 years of age (B; warm colors indicate increases in the strength of connectivity and cool colors indicate decreases in the strength of connectivity between the twotime points). See Supplemental Tables S4–S7 for full breakdown of significant clusters (abbreviations denoted in Table S3). (L HIP: left hippocampus; R HIP: right hippocampus; Neo: neonate; 1yr: 1-year-old; 2yr: 2-year-old; Neo-1yr: neonate to 1-year-old; 1yr-2yr: 1-year-old to 2-years-old; Neo-2yr: neonate to 2-years-old)

