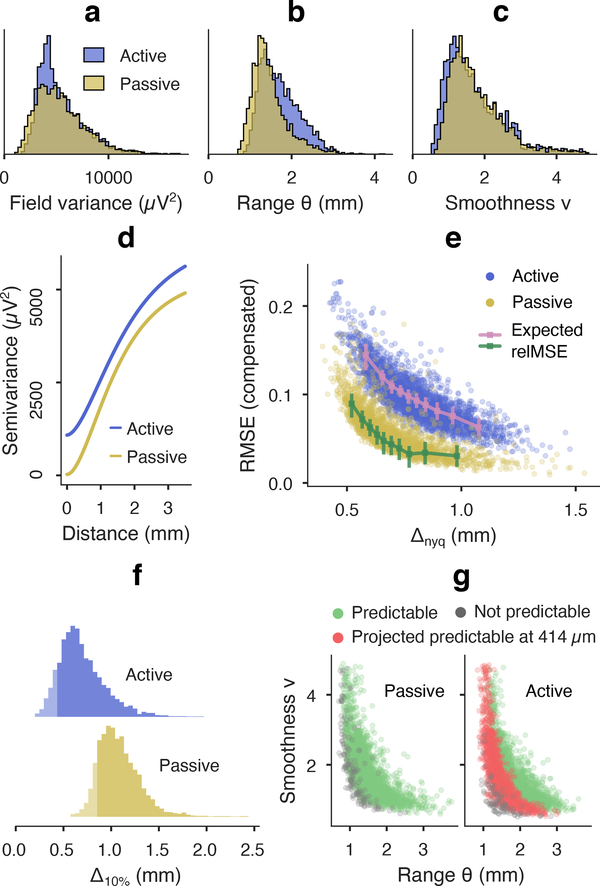
Figure 5.
Kriging results for low and high noise recordings in anesthetized rat auditory cortex. (a)-(c) Variogram kernel parameter distributions from four paired auditory cortex recordings in two rats with low noise “passive” and high noise “active” electrodes (n=3081 passive signal batches, n=3459 active batches). Kernel parameters pertaining to the LFP process were consistent between devices (BC=0.98 noise-compensated field variance, BC=0.95 range, BC=0.99 smoothness). (d) Median variogram kernels are primarily distinguished by their noise floors: active 1037 μV2 (18.5% signal power) and passive 26.5 μV2 (0.5% power). (e) Noise compensated prediction relMSE was inversely related with spatial scale (summarized by Nyquist pitch Δnyq), and agreed with expected kriging error based on kernel parameters (OLS slope 0.99 and 0.98 for active and passive batches, respectively, r2 = 0.989 combined). Error-bar plots show eq 4 kriging error median and IQR per decile of Δnyq. (f) Distributions of the projected spacing for 10% error (Δ10% “kriging resolution”) for each μECoG snapshot. The 5th percentile probably approximately correct (PAC) spacing was 414 μm (active) and 844 μm (passive). (g) Predictability coverage over field batches is depicted in the Matérn parameter space. Green/gray dots mark fields at ≤ 10% and > 10% relMSE, respectively, at subsampled spacing. Red dots mark fields projected to become predictable with PAC spacing (414 μm) for the active electrode.

