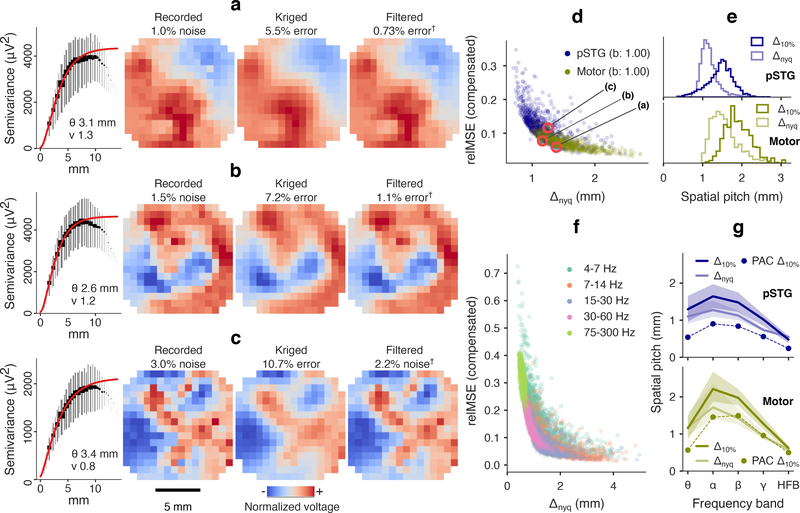
Figure 8.
Kriging results in anesthetized human pSTG and motor cortex. (a) Variography and prediction results for a low resolution/low error motor cortex field. Optimal predictions are also shown (“†” per figure 4). Long range and locally-regular (high smoothness index) patches of similar polarity were accurately predicted 1.52 mm subsampled spacing. Cross-validated kriging relMSE was 6.5% relMSE (1.0% noise and 5.5% kriging error). (b) A shorter range, but smooth field batch was predicted with 8.7% relMSE (1.5% noise and 7.2% kriging error). (c) A rough field batch was predicted at 13.7% relMSE (3.0% noise, 10.7% kriging error), which was above the 10% predictability threshold. The low smoothness index indicated texture detail that was lost to interpolation. (d) Noise-subtracted prediction error for broadband (4–300 Hz) fields was inversely related to spatial scale (Δnyq). The three snapshots in (a)-(c) are marked. Expected kriging error explained relMSE error with linear slopes of b = 1.00 (each subject), r2 = 0.898 (combined). (e) Central tendencies of kriging resolution (pSTG: 1.48 mm median, motor: 1.87 mm median) exceeded Nyquist pitch (pSTG: 1.13 mm median, motor: 1.50 mm median), but approached similar values at the lower tails. PAC spacing was 829 μm in pSTG and 1.43 mm in motor cortex. (f) Grouped prediction error (relMSE combined subjects) for bandpass fields depended on Nyquist pitch, but tended higher in theta band due to rough texture, and at higher frequencies due to falling SNR. Per band and per subject, expected relMSE regressed actual kriging error with slopes 0.93 < b < 1.11 (combined model r2 = 0.982). (g) Nyquist pitch (light lines, median and IQR) underestimated kriging resolution (dark lines) in bands with smoother fields and high SNR. PAC spacing was 240–902 μm in pSTG and 498 μm-1.49 mm in motor cortex.

