
Figure 1 –
Swept Source OCT Angiography (SS-OCTA) of Retinal Neovascularization Demonstrates the Utility of Interpreting SS-OCTA B-Scans Alongside en face SS-OCTA Images.
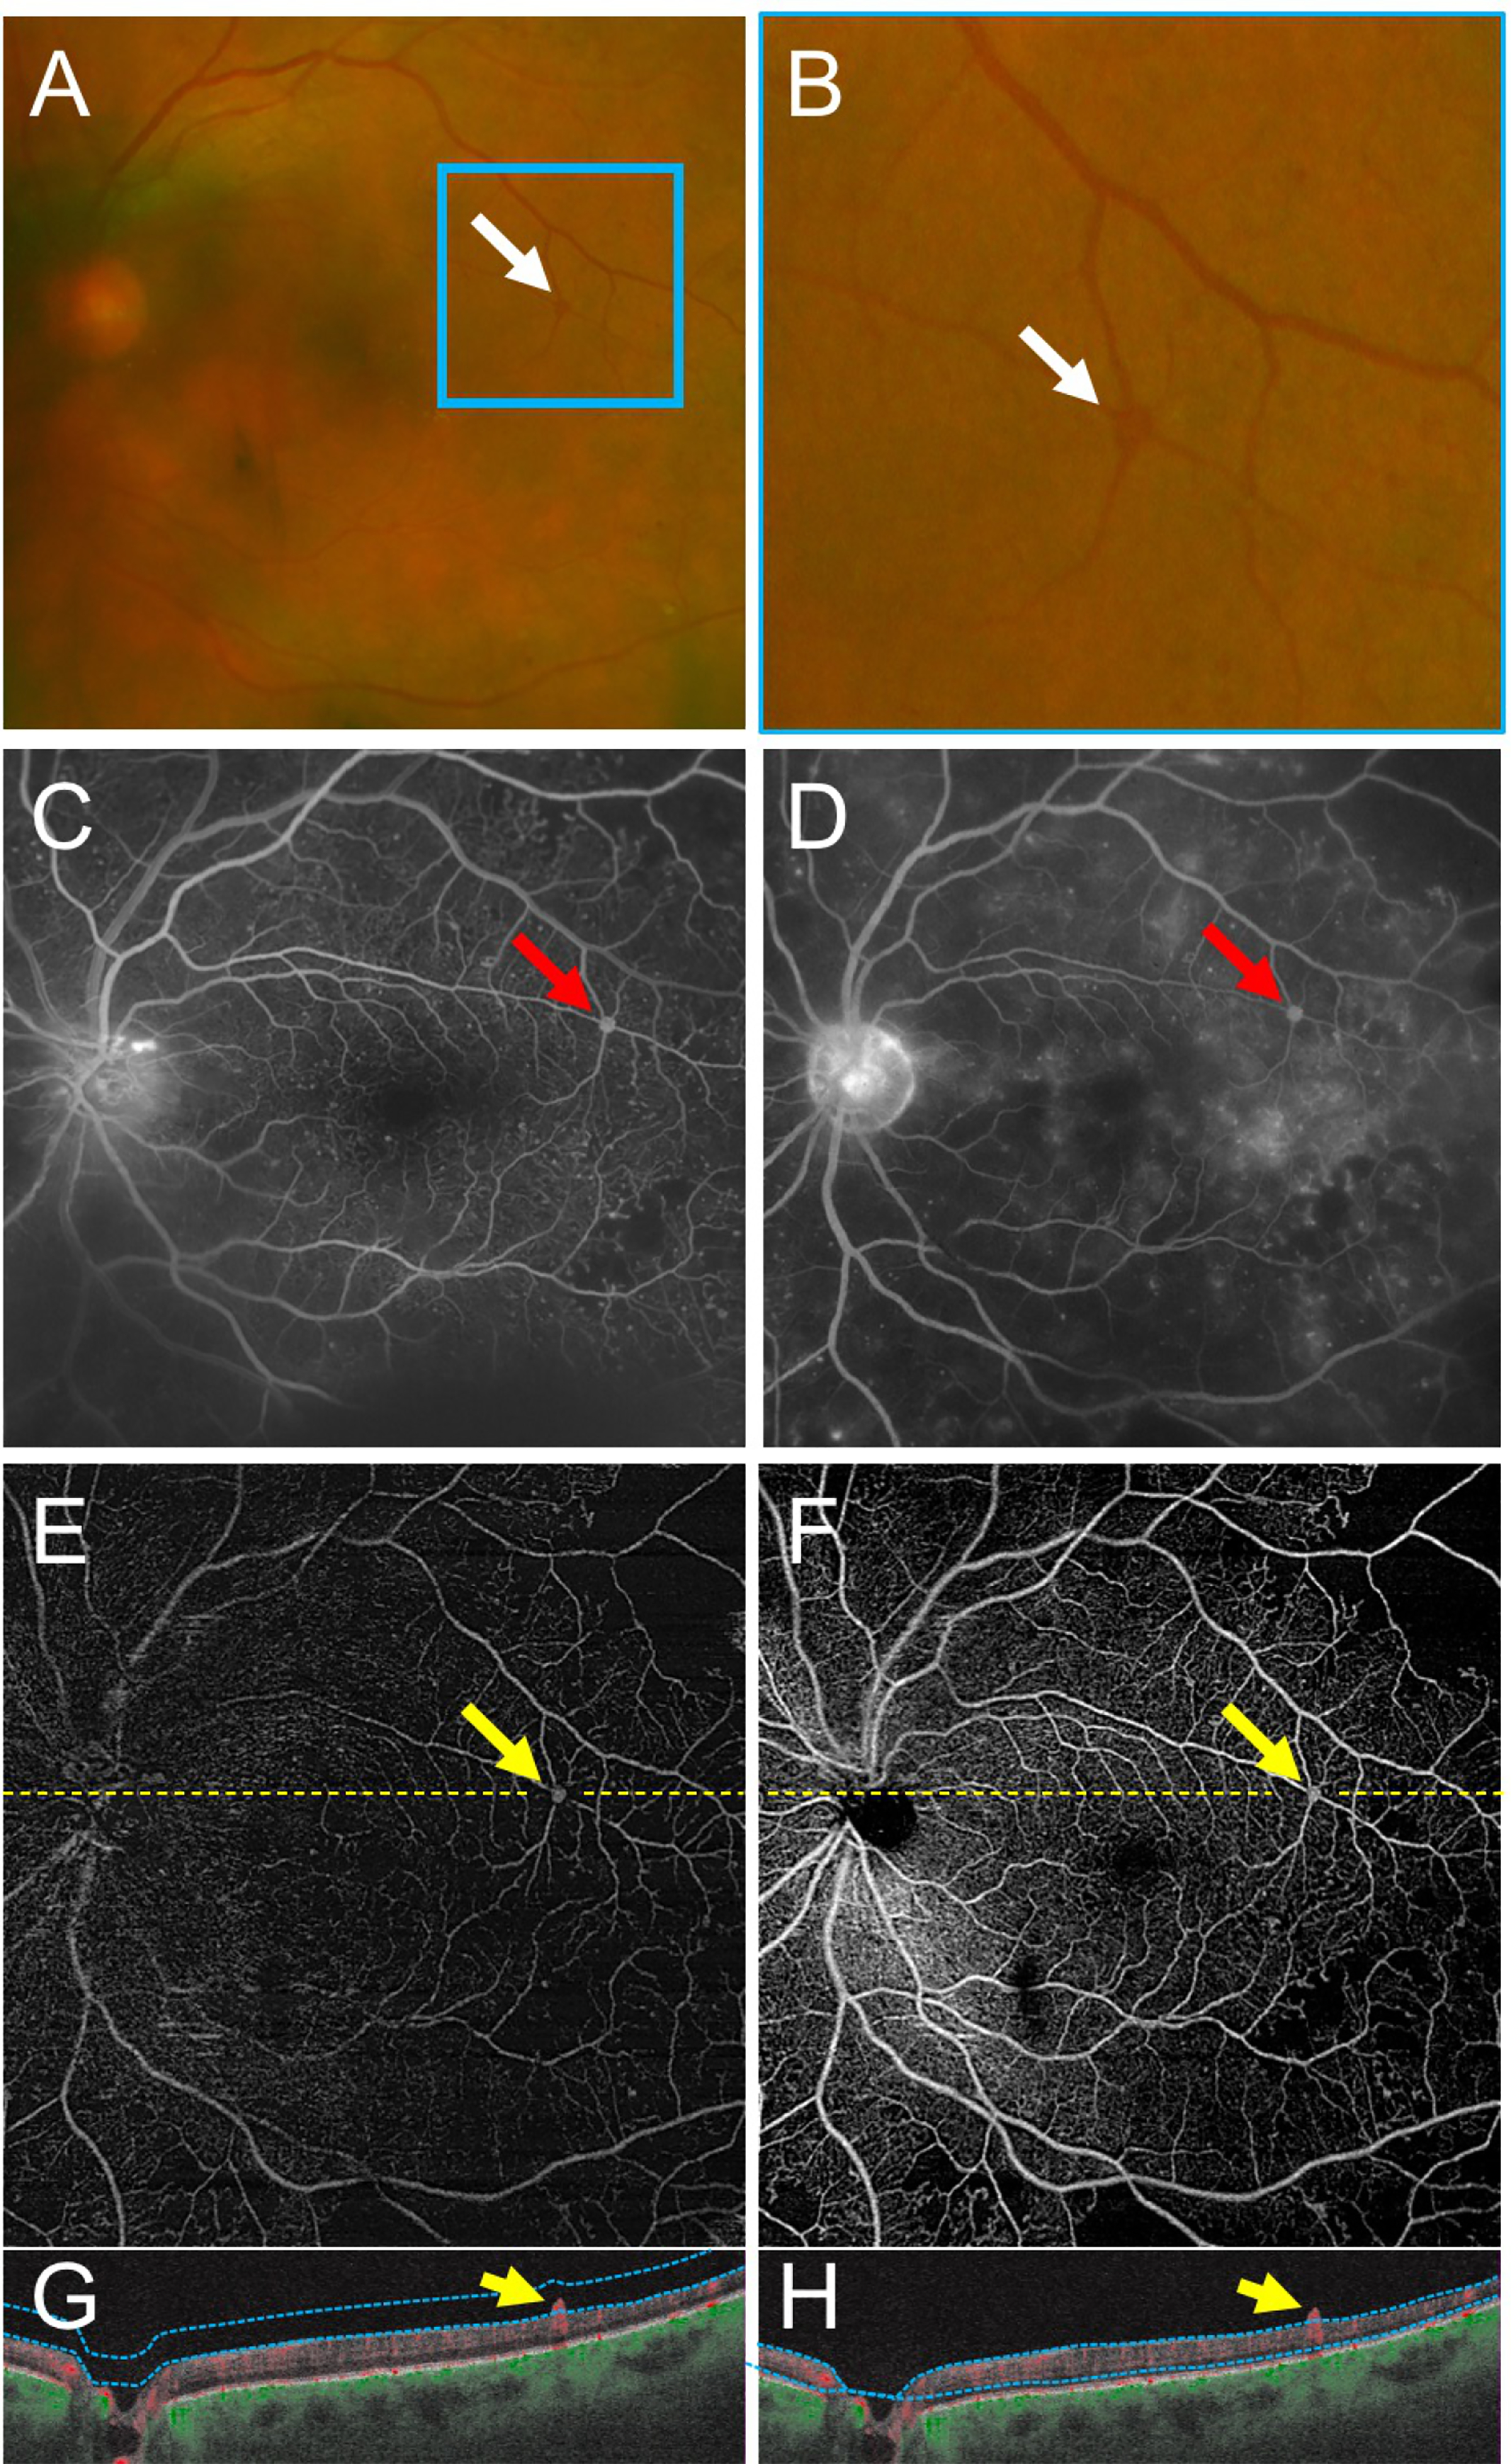
(A,B) Fundus photographs show an area suspicious for retinal neovascularization (NV) near the superotemporal arcade (A, white arrow; magnified in B). Early (C) and late (D) fluorescein angiography (FA) images demonstrate an area suspicious for NV in the superotemporal region (red arrows). (E-H) Vitreoretinal interface (E) and total retinal en face SS-OCTA slabs (F) with corresponding SS-OCTA B-scans (G-H) of the same eye on the same day. The yellow arrows correspond to the same region of neovascularization seen in the FA. The B-scans (G,H) demonstrate the lesion extending into the vitreous with a robust SS-OCTA flow signal. Yellow dashed lines depict the locations of corresponding B-scans. Blue dotted lines depict segmentation for the SS-OCTA slabs.