
Figure 3 –
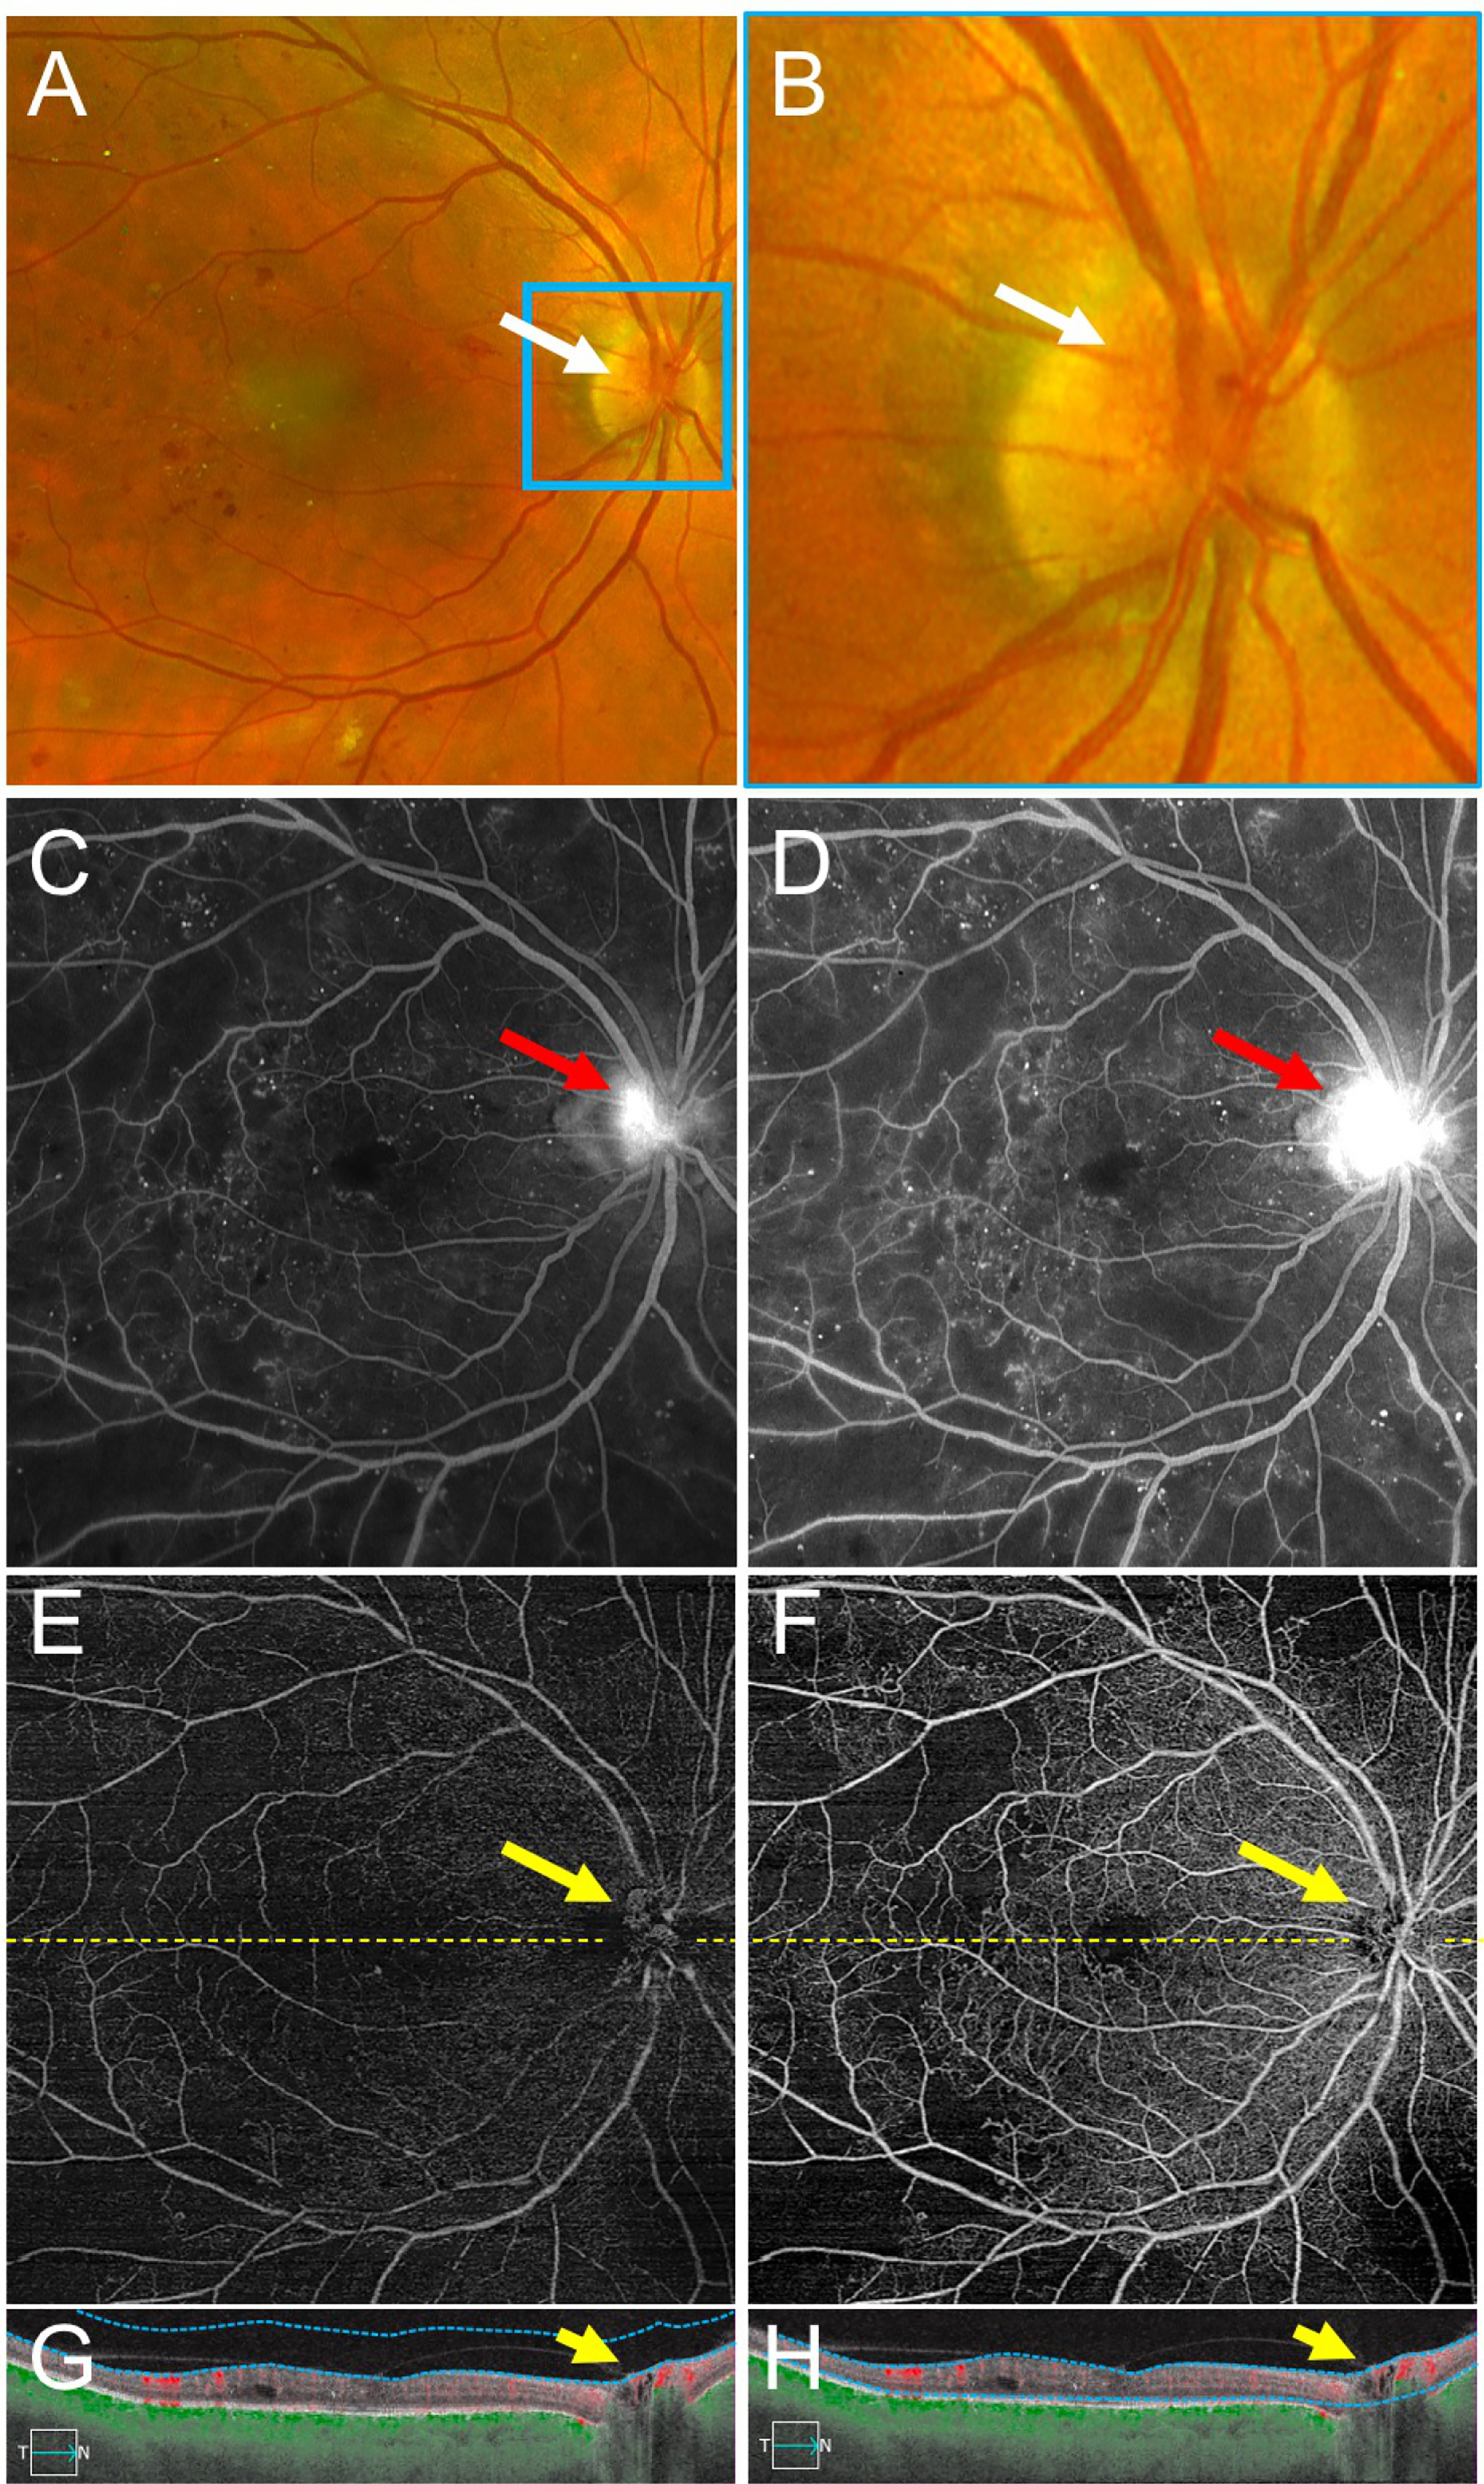
An Example of Neovascularization of the Disc (NVD) Graded Correctly More Frequently with Fluorescein Angiography (FA) Compared with Swept Source OCT Angiography (SS-OCTA).
(A,B) Fundus photography demonstrates NVD (white arrow). A network of fine vessels can be seen in the magnified image (white arrow) (B). (C,D) Early (C) and late (D) FA images show early hyperfluorescence with late leakage from NVD over the optic nerve (red arrows). (E-H) Vitreoretinal interface (E) and total retinal en face SS-OCTA slabs (F) with corresponding SS-OCTA B-scans (G-H) from the same eye on the same day. The vitreoretinal interface slab (E) highlights the area of NVD (yellow arrow). On the B-scans (G,H), a fibrovascular membrane with a flow signal is seen traversing the optic cup (yellow arrow). Yellow dashed lines depict the locations of corresponding B-scans. Blue dotted lines depict segmentation for the OCTA slabs.