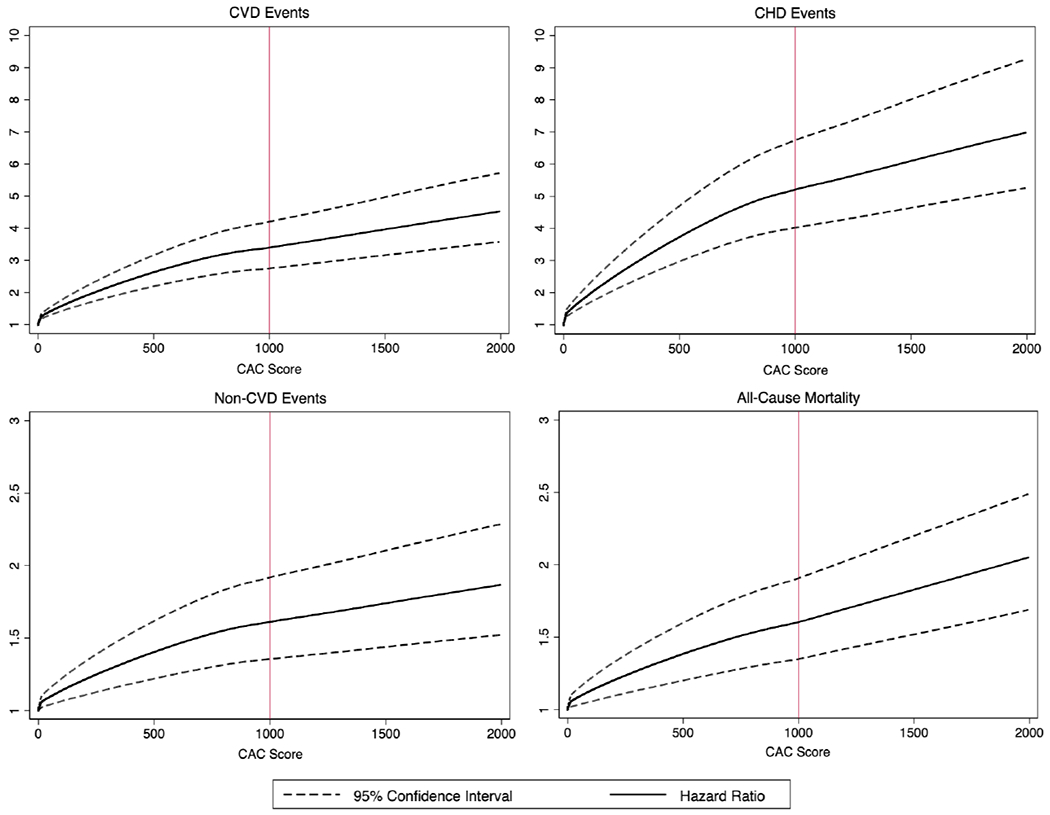
Figure 1. Multivariable-adjusted hazard ratios and 95% CI for CVD events, CHD events, non-CVD events, and all-cause mortality as a function of CAC score.

Cubic splines were used in the multivariable model with knots placed at CAC=100 and CAC=1000. Hazard ratios were adjusted for age, sex, race/ethnicity, obesity, hypertension, total cholesterol, HDL-cholesterol, triglycerides, smoking, diabetes, family history of myocardial infarction, anti-hypertensive medications, cholesterol medications.
