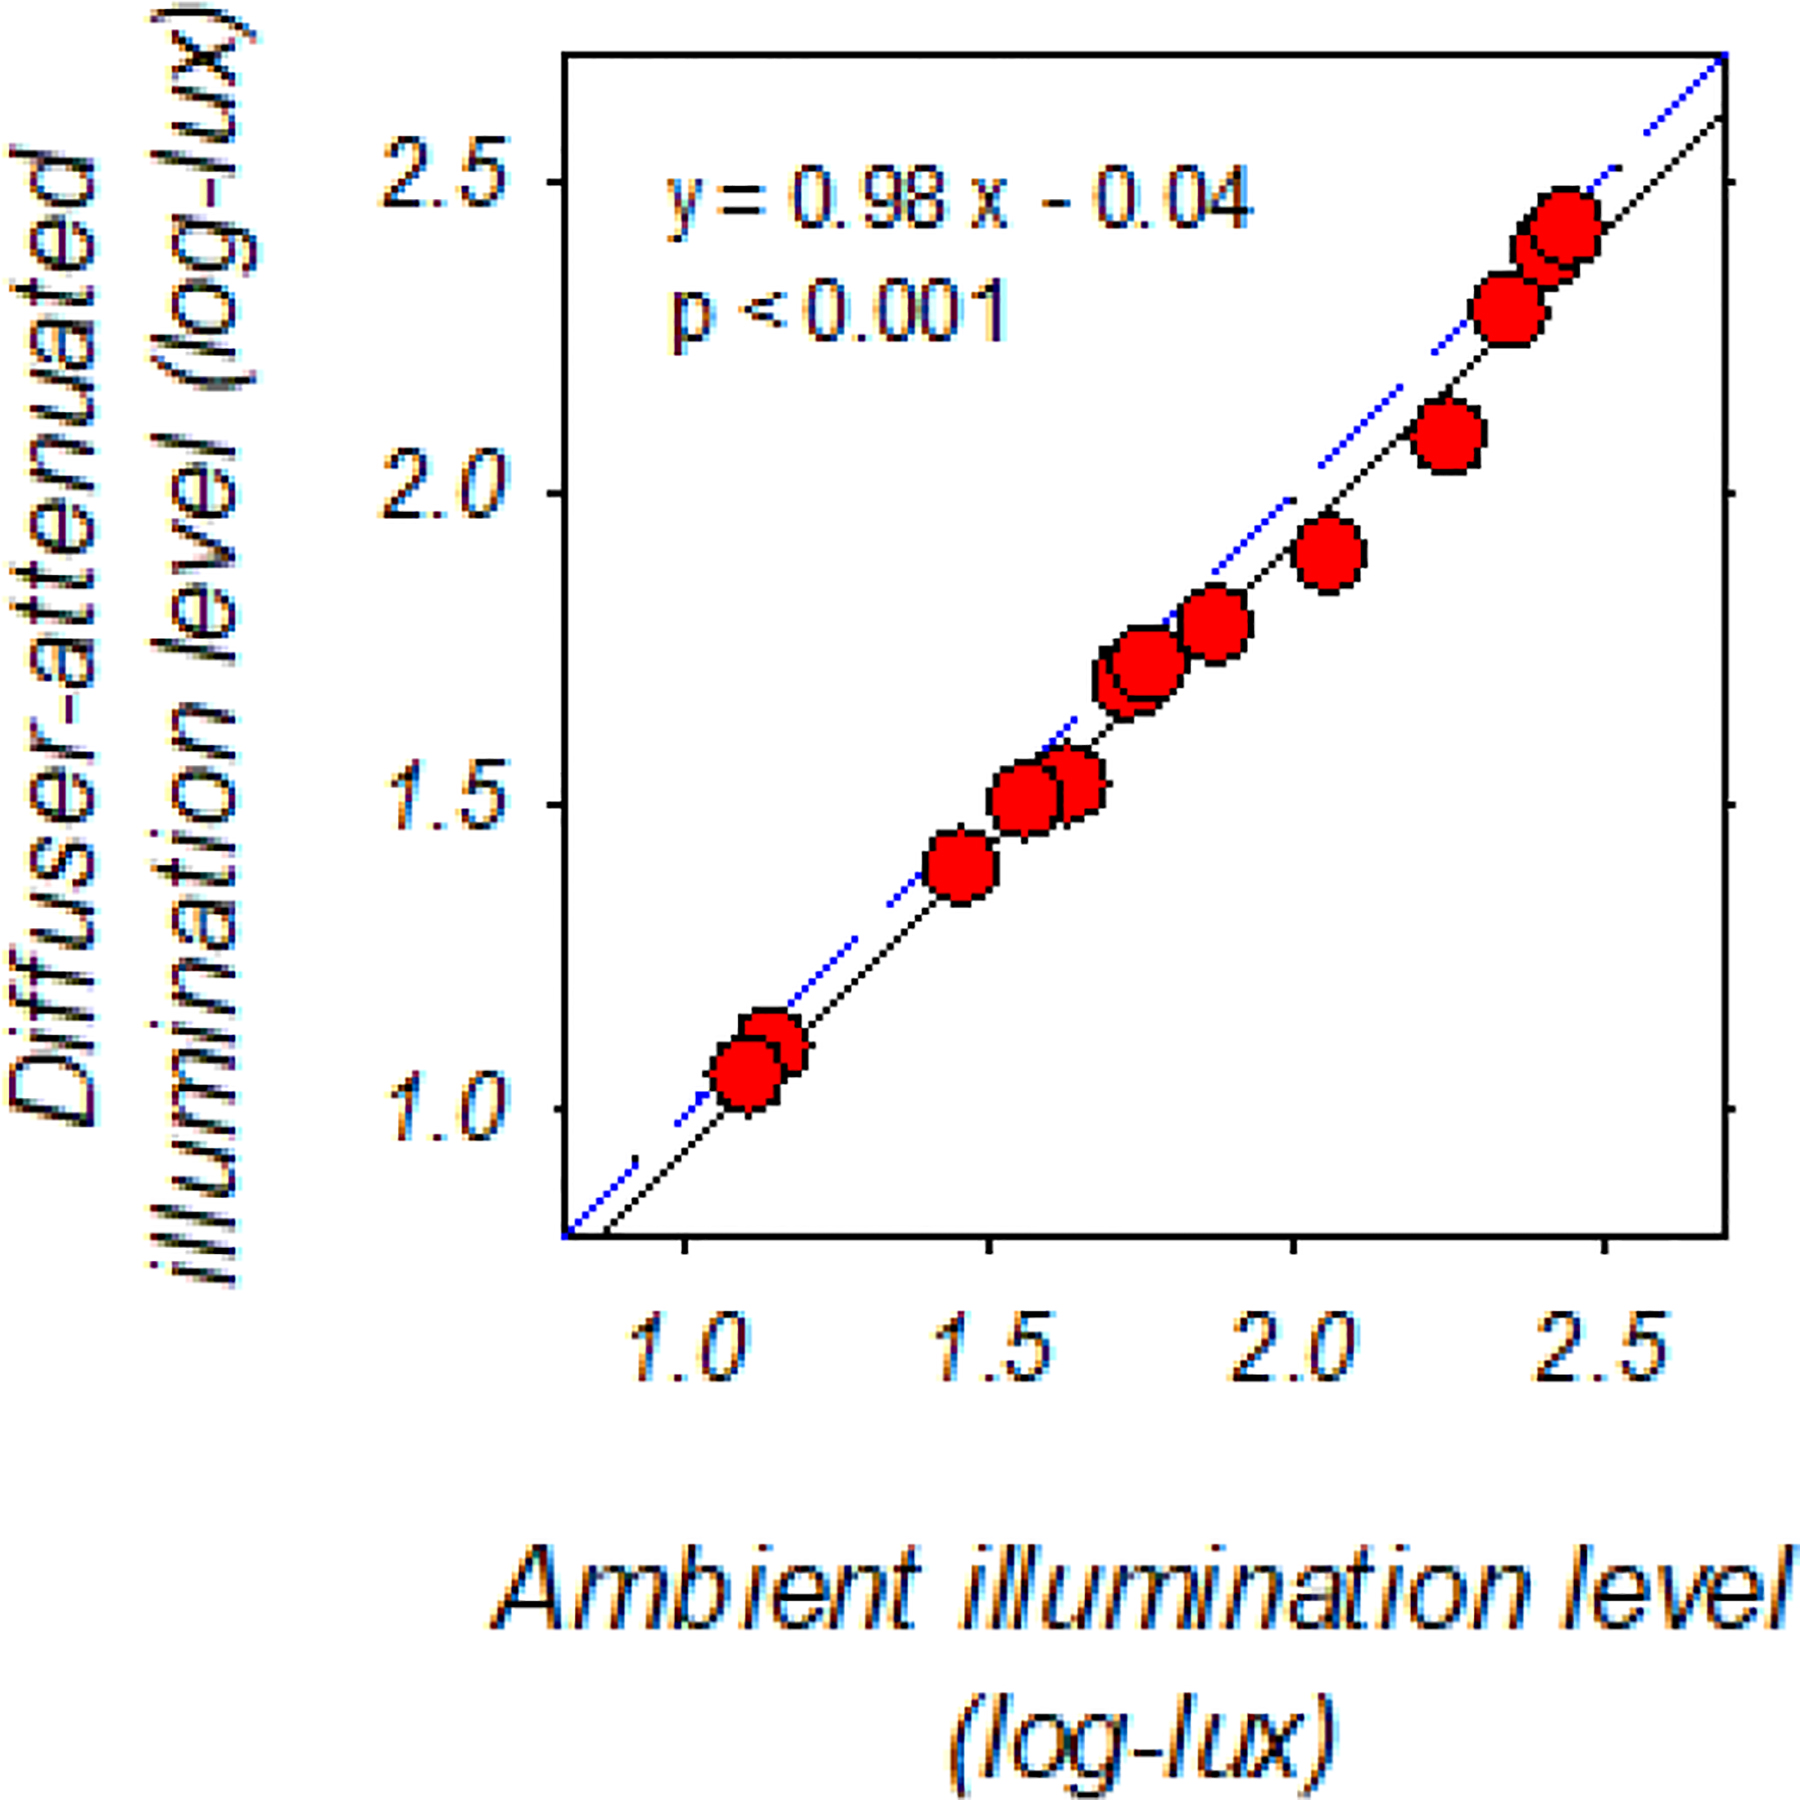
Figure 1.

Diffuser-attenuated illumination levels plotted as a function of the corresponding ambient illumination levels on common logarithmic scales. The ambient lighting levels were within the dim-to-normal range employed in the present study. The blue dashed line represents zero diffuser-induced light attenuation, whereas the black regression line represents the linear relationship between diffuser-attenuated and unfiltered ambient illumination levels. To measure the diffuser-attenuated illumination levels, a piece of diffuser foil was attached to a zero-power carrier lens, of which the peripheral area was taped to block stray lights. The center of the diffuser lens was then placed perpendicular to the measurement axis of the spectrophotometer at a 14 mm distance (CL-500A, Konica Minolta Sensing Americas, Inc. NJ, USA). For the measurement of corresponding ambient illumination levels, another taped carrier lens with a clear center of equal size was used in place of the diffuser lens.
