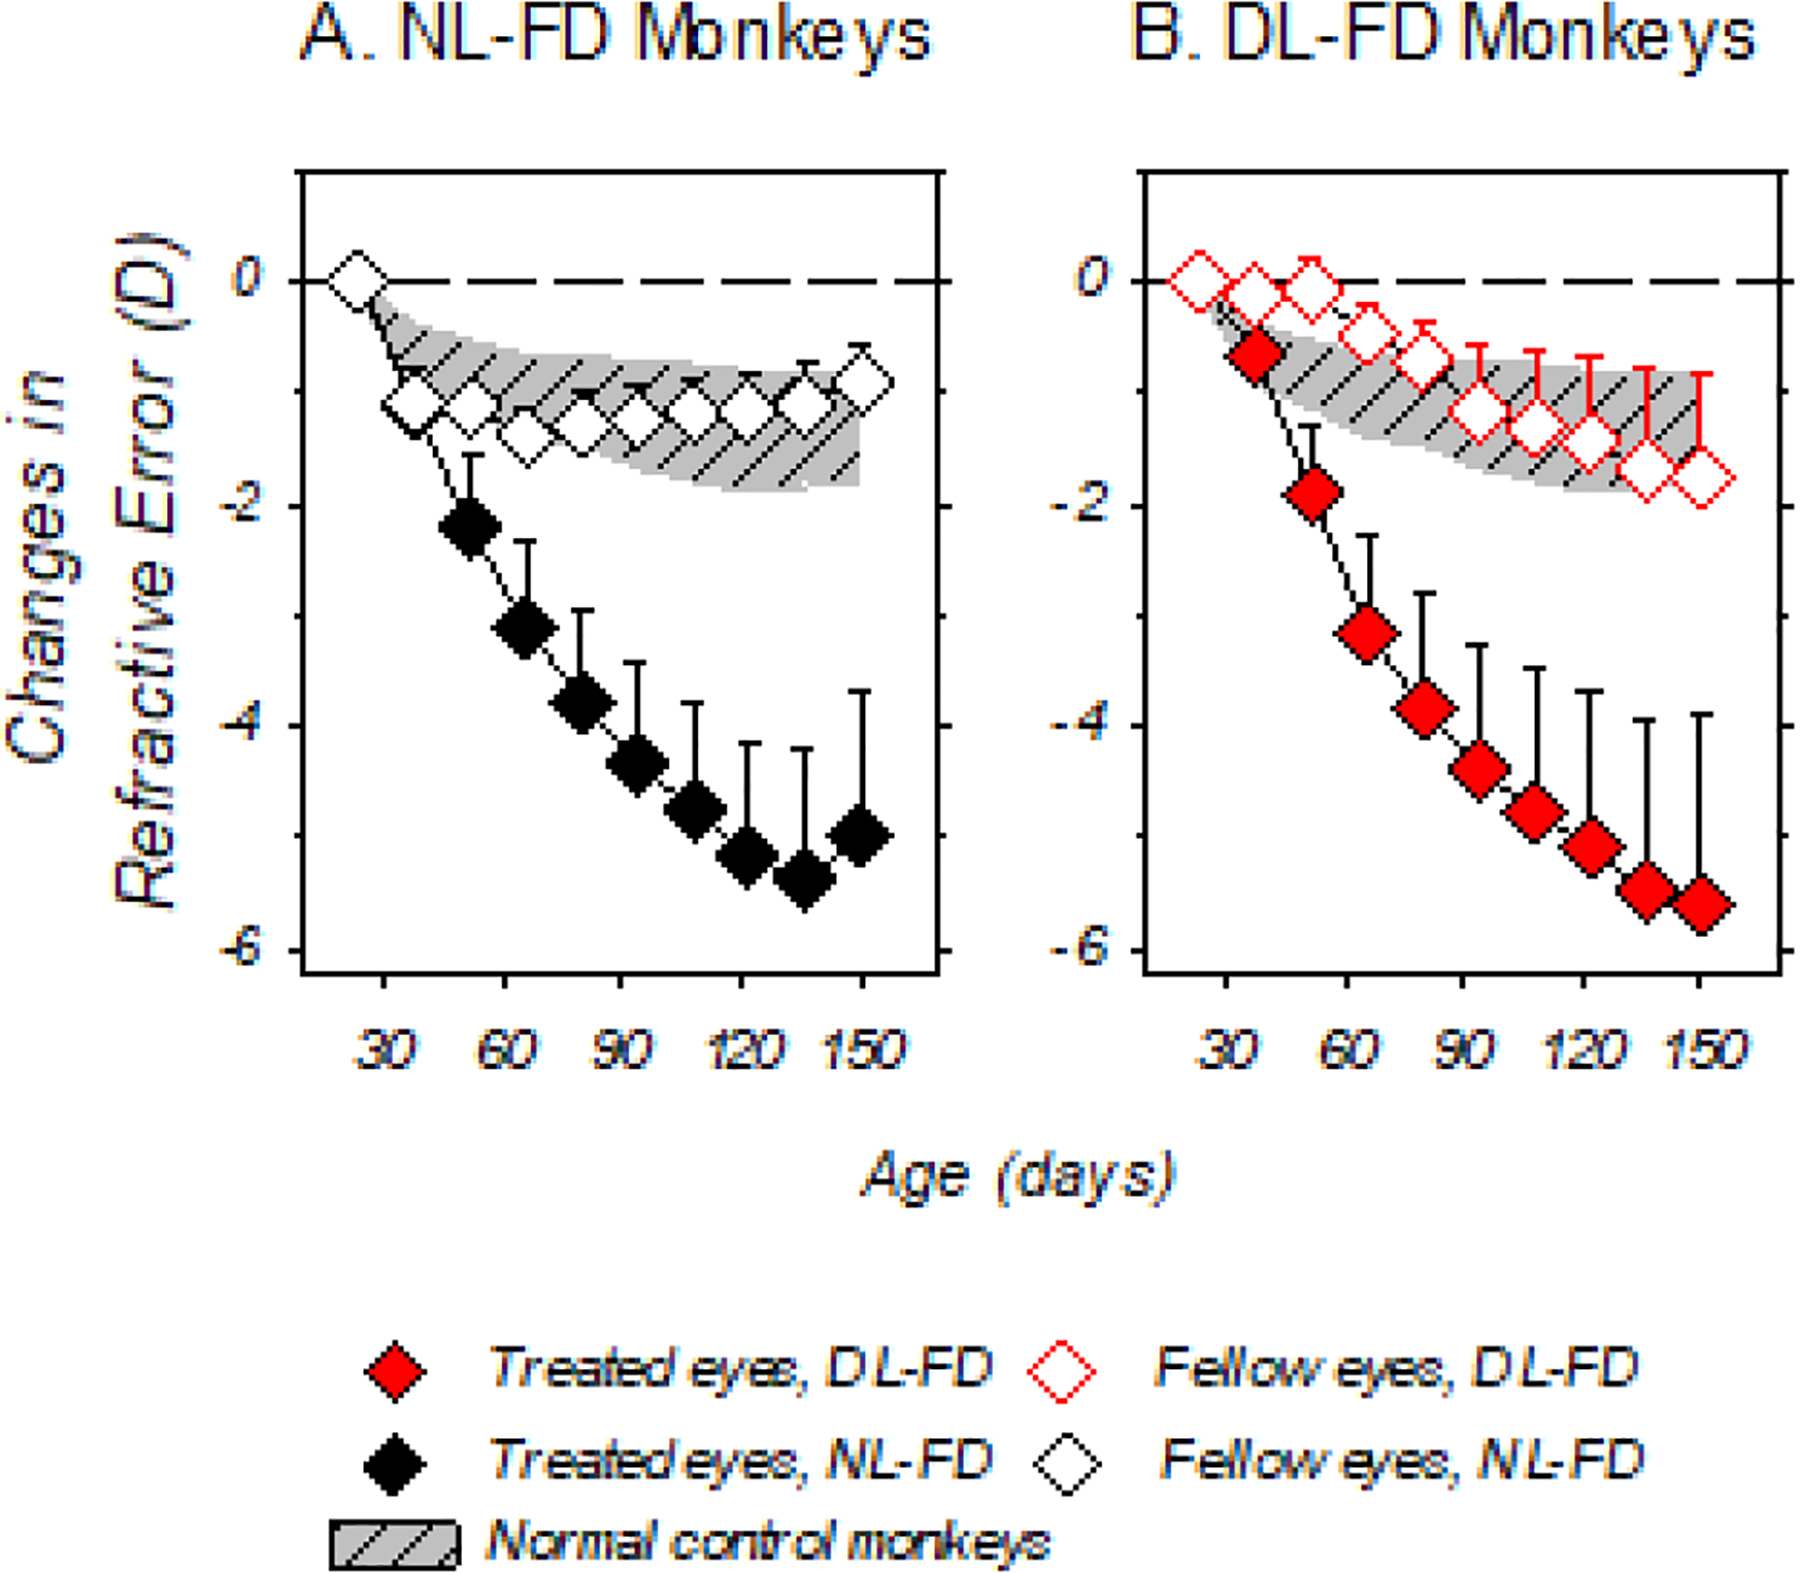
Figure 3.

Mean (+SD) refractive-error changes relative to baseline plotted as a function of age. The closed and open symbols represent the treated and control eyes of the NL-FD (Panel A) and DL-FD (Panel B) monkeys, respectively. The shaded areas represent the 95% confidence range for the changes in refractive error in the right eyes of the age-matched, normal-control monkeys.
