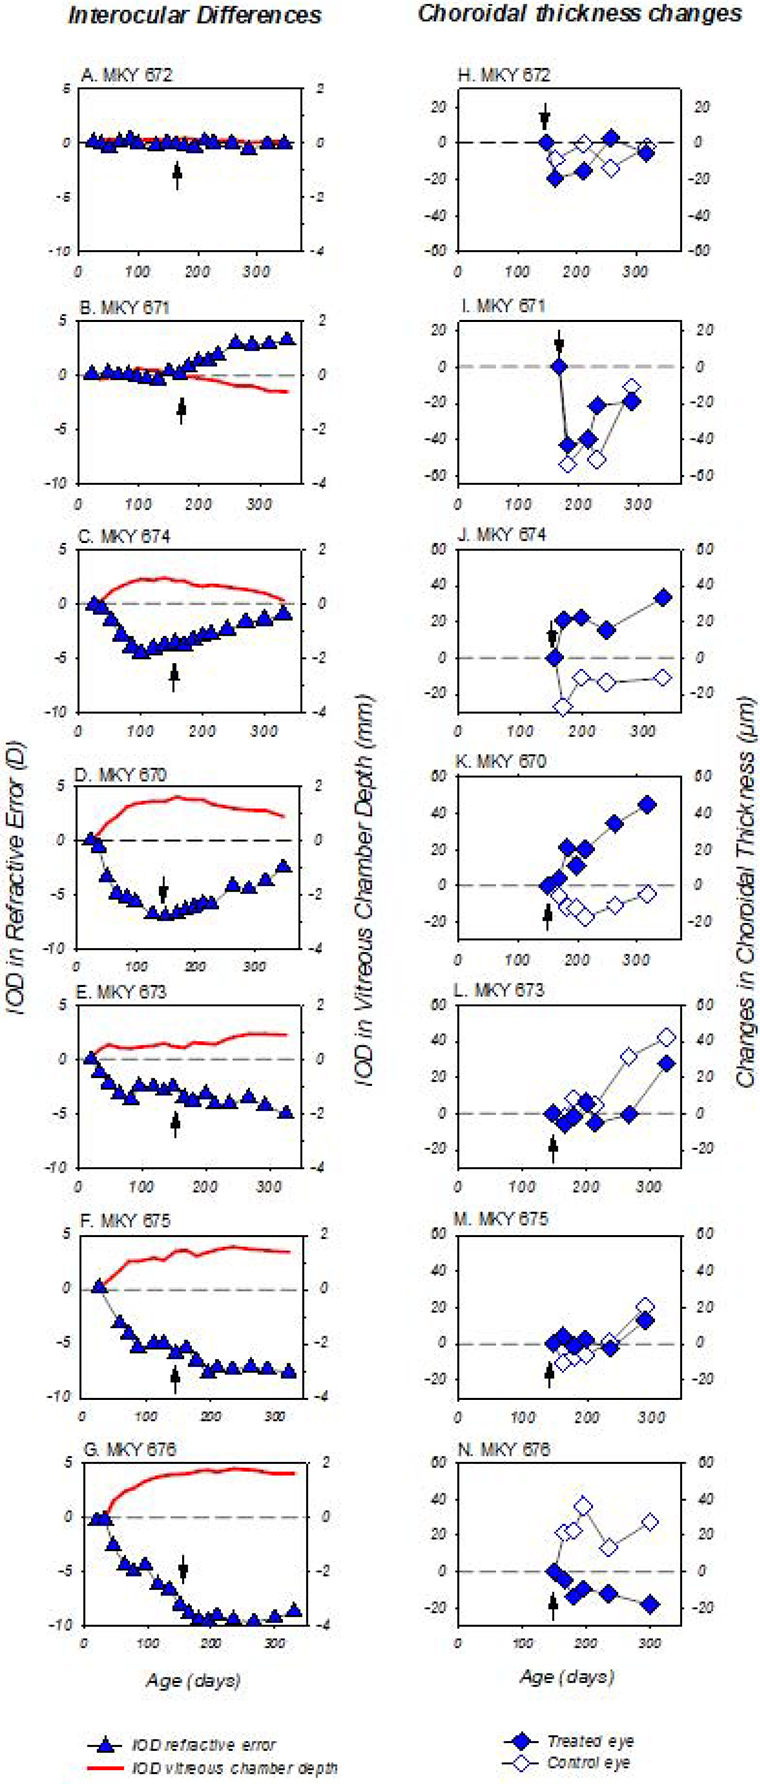
Figure 9.

Panels A – G (left column): interocular differences (treated eye – fellow eye) in refractive error (blue symbols) and vitreous chamber depth (solid red lines) obtained during the dim-light-rearing period plotted as a function of age for individual DL-FD subjects. Dashed lines: zero anisometropia/interocular difference in refractive error and vitreous chamber depth. Black arrows: ages that correspond to the end of the diffuser treatment. Note the temporal correlation between the IODs in vitreous chamber and refractive error. Panels H – N (right column): changes in choroidal thickness in the treated (filled symbols) and control eyes (open symbols) of the DL-FD monkeys obtained during the recovery period plotted as a function of age. The first symbol in each plot represents data obtained at the age corresponding to the end of the diffuser-rearing period (i.e. black arrows in panels A – G). The choroidal thicknesses are specified relative to the thicknesses obtained at the end of the dim-light-diffuser period. Dashed lines: zero change in choroidal thickness (right column panels).
