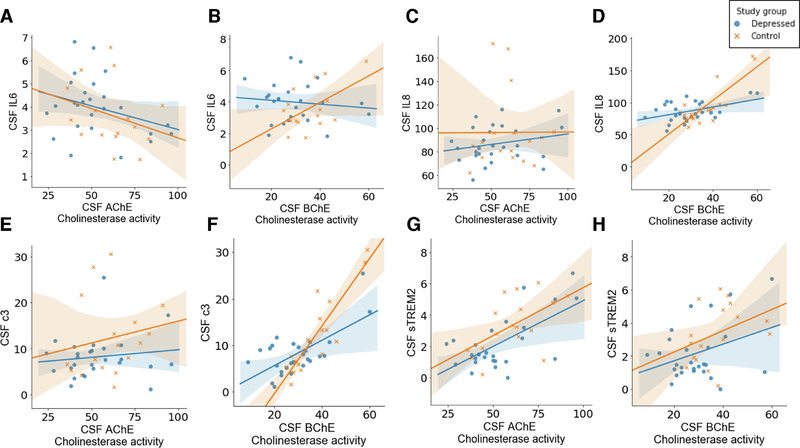
Figure 3. Correlations between CSF cholinesterase AChE and BChE with CSF biomarkers (IL6, IL-8, C3, and sTREM2) for LLMD and Controls.
The CSF measurement was taken for a smaller subset of participants, LLMD (N=28) and Controls (N=19). Regression (Spearman) plots comparing LLMD with controls for AChE with CSF IL-6 (a) with CSF IL-8 (c), with CSF C3 (e), and with sTREM-2 (g). For LLMD (r = 0.383, p = 0.049) and Controls (r = 0.494, p = 0.044), CSF AChE was associated with higher sTREM2. Regression (Spearman) plots comparing LLMD with controls for BChE with CSF IL-6 (b), with CSF IL-8 (d), with CSF C3 (f), and with TREM-2 (h). CSF BChE was correlated with C3 in both the LLMD group (r = 0.423, p = 0.028) and Controls (r = 0.813, p < 0.001).

