Fig. 2.
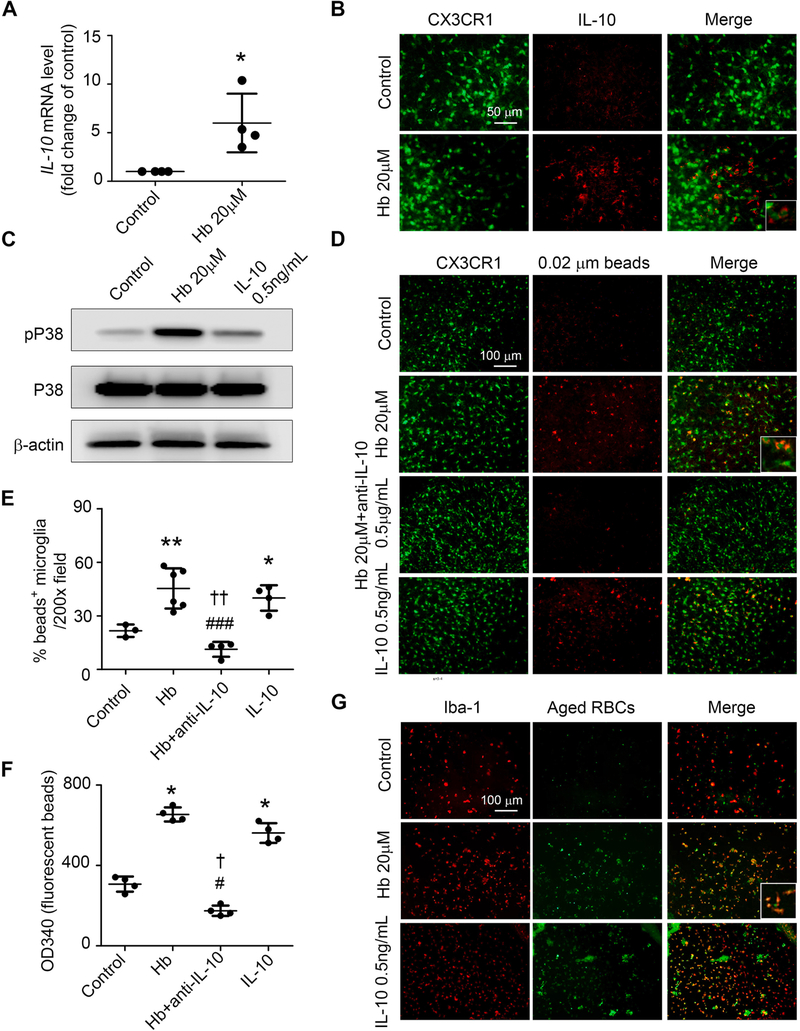
Hemoglobin (Hb) induces microglial phagocytosis by regulating IL-10 in OHSCs. OHSCs prepared from CX3CR1GFP/+ (A-F) or C57BL/6 (G) pups were treated as indicated for 16 h. (A) mRNA was extracted from the OHSCs, and real-time RT-PCR was carried out with IL-10 primers. *p < 0.05 vs. Control. n = 4. (B) Slices were fixed and immunostained with IL-10 antibodies. (C) OHSCs were collected and homogenized for Western blotting. β-actin served as a loading control. (D-F) OHSCs were incubated with fluorescence-conjugated latex beads (0.02-μm diameter) for 4 h and fixed before imaging. Representative images from the CA1 region (D) and quantification of bead+/GFP+ cells (E) are shown. Insets are high-power images showing microglia with engulfed beads. Tissue from another experimental group was collected and lysed to detect fluorescence intensity on a plate reader (F). *p < 0.05, **p < 0.01 vs. Control; #p < 0.05, ###p < 0.001 vs. Hb; †p < 0.05, ††p < 0.01 vs. IL-10. n = 3–6. (G) OHSCs were incubated for 4 h with aged RBCs prepared from GFP-UBC mice, fixed, and immunostained with Iba-1 antibodies. Representative images from the CA1 region are shown. Insets are high-power images showing colocalization of GFP-RBCs and microglia. A: Student’s t-test followed by Welch’s correction; E, F: One-way ANOVA followed by Dunn’s multiple comparison post-hoc test. Results are from at least three independent experiments. Scale bars: (B) 50 μm; (D) and (G) 100 μm.

