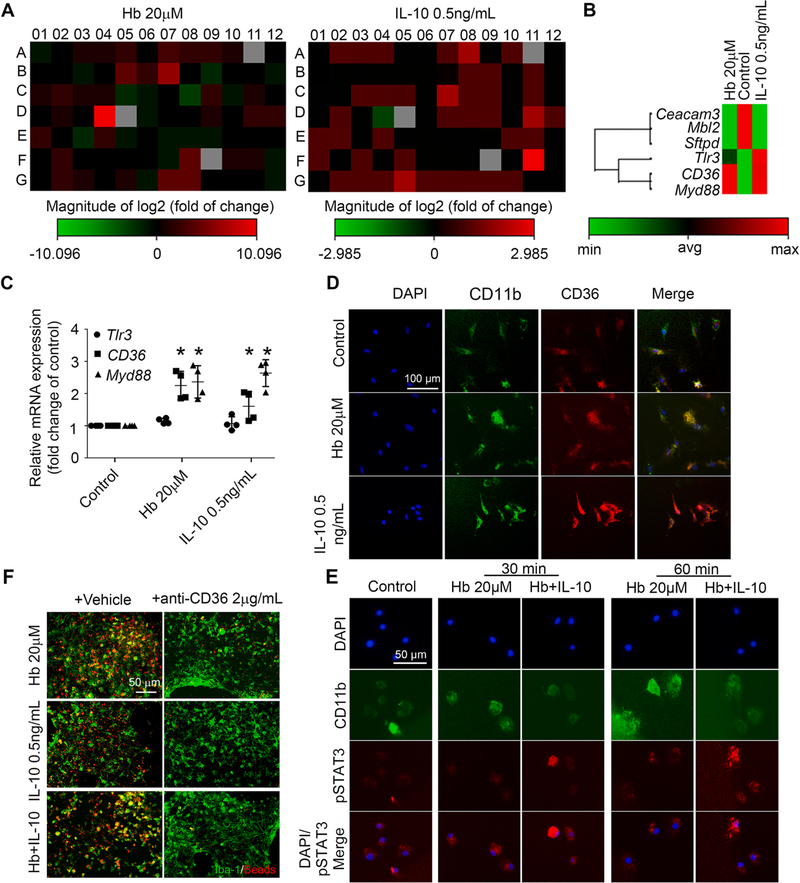
Fig. 9. IL-10 and CD36 are required for microglial phagocytosis activity in vitro.
(A, B) OHSCs prepared from C57BL/6 pups were treated as indicated for 16 h, mRNA was extracted, and real-time RT-PCR was carried out with a phagocytosis PCR array. (A) Heat map of gene changes compared with control group. (B) Hemoglobin (Hb)- and IL-10–co-regulated gene sets. (C, D) Mouse primary microglia were treated as indicated for 16 h. (C) mRNA was extracted from the mouse primary microglia, and real-time RT-PCR was carried out with different primers. *p < 0.05 vs. corresponding Control; n = 3–4. (D) Cells were fixed and immunostained with CD11b and CD36 antibodies. Nuclei were stained with DAPI. Representative images are shown. (E) Mouse primary microglia were treated as indicated. Cells were fixed and immunostained with CD11b and pSTAT3 antibodies. Nuclei were stained with DAPI. Representative images are shown. (F) OHSCs were treated as indicated for 16 h and then incubated with fluorescence-conjugated latex beads (4-μm diameter) for 4 h, fixed, and immunostained with Iba-1 antibodies. Representative images are shown. C: One-way ANOVA followed by Dunn’s multiple comparison post-hoc test. All results are from at least three independent experiments except for A and B. Scale bars: (D) 100 μm; (E) and (F) 50 μm.

